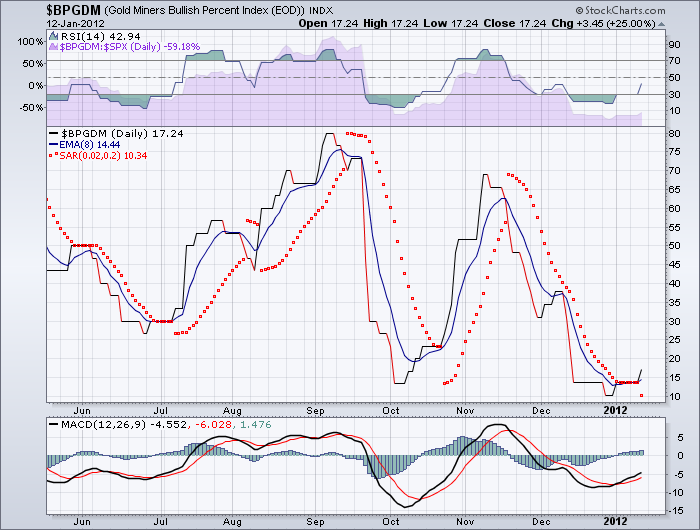
Here is the $BPGDM chart.
This chart shows what percent of gold mining stocks are on a buy signal on a point and figure chart system.
I am not bullish on $GOLD due to the $USD strength.
But the indicators are saying buy the gold miners - or at least trade the index.
Well, you can see it flipped the parabolic SARS on the chart today. This would be an entry signal.
If you wanted to do this trade, you could buy the HUG.TO which is an ETF on gold miners. You could also buy the XGD.TO.
Lots of other things to examine, but perhaps this GOLD miners move has legs.
Good Trading,
Greg Schnell, CMT

About the author:
Greg Schnell, CMT, MFTA is Chief Technical Analyst at Osprey Strategic specializing in intermarket and commodities analysis. He is also the co-author of Stock Charts For Dummies (Wiley, 2018). Based in Calgary, Greg is a board member of the Canadian Society of Technical Analysts (CSTA) and the chairman of the CSTA Calgary chapter. He is an active member of both the CMT Association and the International Federation of Technical Analysts (IFTA).
Learn More
