Well, couple of things have really traded wildly leading up to the European Summit.
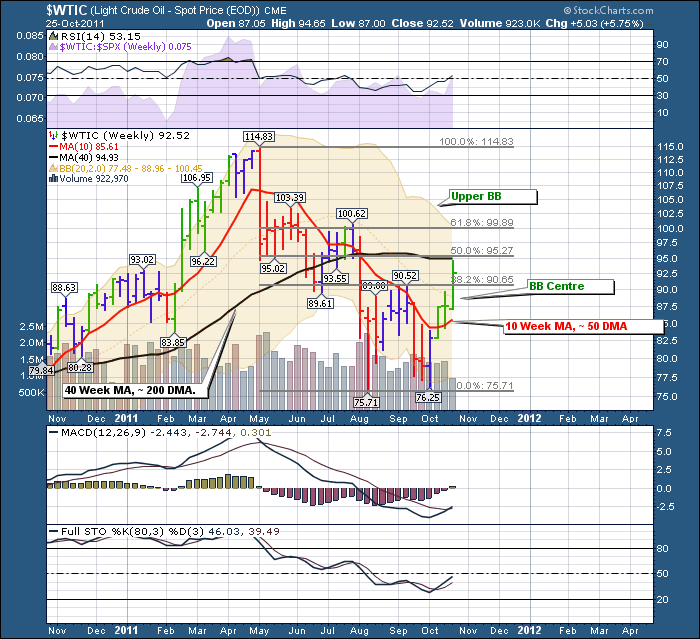
Here is a chart of West Texas Crude.
When people talk about retracement levels, some just throw it away as nonsense. Technicians use retracements. This chart is a classic so far.
First of all, Oil fell from it's high and made a low. We discussed that previously. But look at the Price action off the first low.
1)Bounced off the low right up to the 38.2% retracement and reversed. It then when all the way back down, tested the low and pushed higher. It paused at the 10 week MA, it stopped last week just shy of the 38.2% retracement, and has now surged up to test the 50 % retracement line. It was also the 40 week line. So where to from here.
Well, there is backwardation in the crude chain, which says they are paying more for the front month so that pulls inventory forward. This is supportive of price.
So lets examine if crude moves higher, where might it stop.
Well, the upper Bollinger band and the 61.8% retracement are just about on top of each other, so that would be a logical target if we get above the 40 week and the 50% retracement where we stalled today.
That $99 level being so close to the $100 number should be sufficient for a pause. Round numbers like $100 can be meaningful resistance as well.To see an example of that you may wish to look at Netflix (NFLX). It spent 5 days trying to get through $300. I did, but could not stay up there. We all know where it went from there!
So if the Europeans can functionally put together a strategy and the world get temporary relief, we could expect to see $WTIC try to test $100.
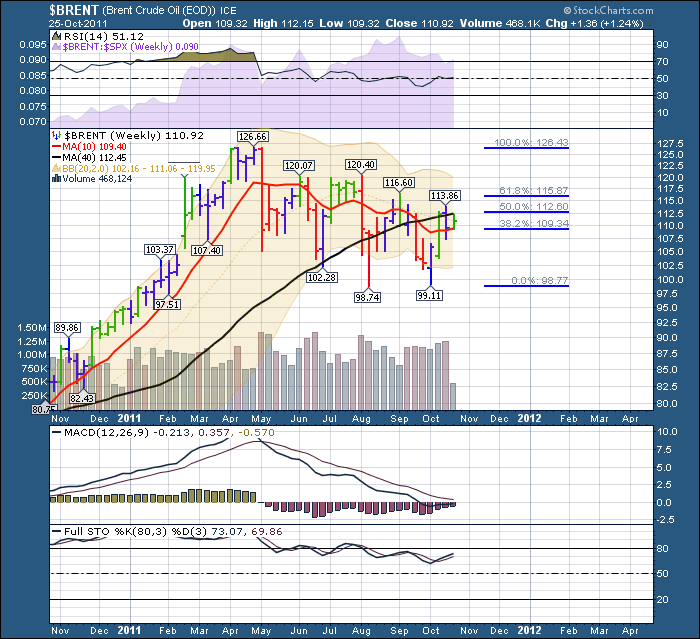
For Brent
What is interesting here, is that brent has not fallen as hard. However, today, $BRENT and $WTIC both sit testing their 40 Week MA's from the bottom. Notice above, Brent has it's 61.8% retracement around $115 and the Bollinger band is closer to $120.
The energy sector has led in October so far. Let's hope solutions in the Euro zone can allow us to focus on companies in the market soon. If the Oil's can push higher, it is always good for our $TSX.
To execute this trade, you can use XEG.TO for oil stocks, or XIU.TO for the Canadian TSX 60 as it usually moves with oil. To play the oil price directly, you can use USO.
To subscribe for free to this blog, follow this link and you'll find the subscribe button, top right.
Good Trading,
Greg Schnell.


