Today, we are discussing the commodities within Stockcharts that we can use to Identify food inflation.
I've set up a few dashboards for these. The chart patterns are much different than the base metals, lumber and oil.
To get a list of the commodities, put the little " ^ " symbol in the centre box for creating sharpcharts and it will create a list of all the available futures commodities.
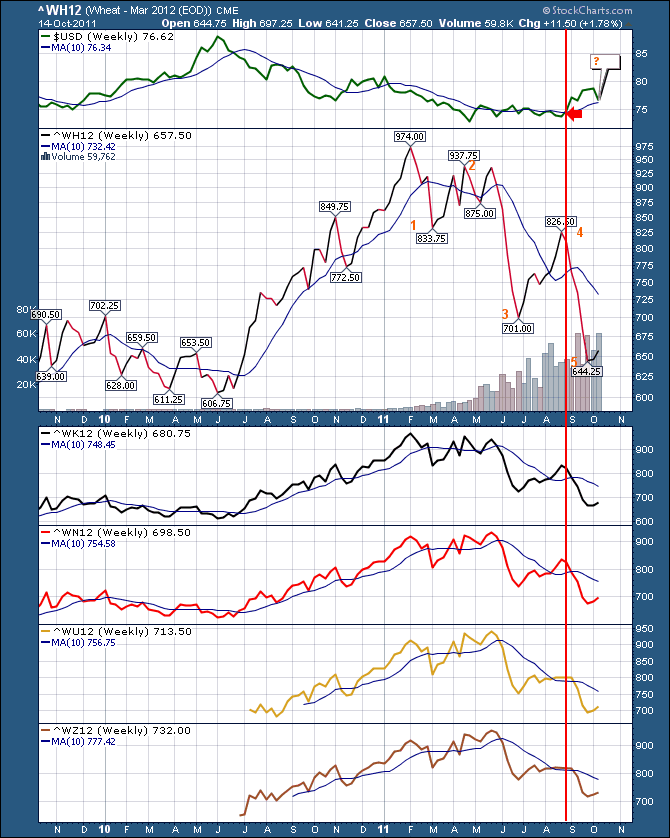
Here is Wheat.
This wheat chart is a typical commodity chart that pulled back when the $USD rose.
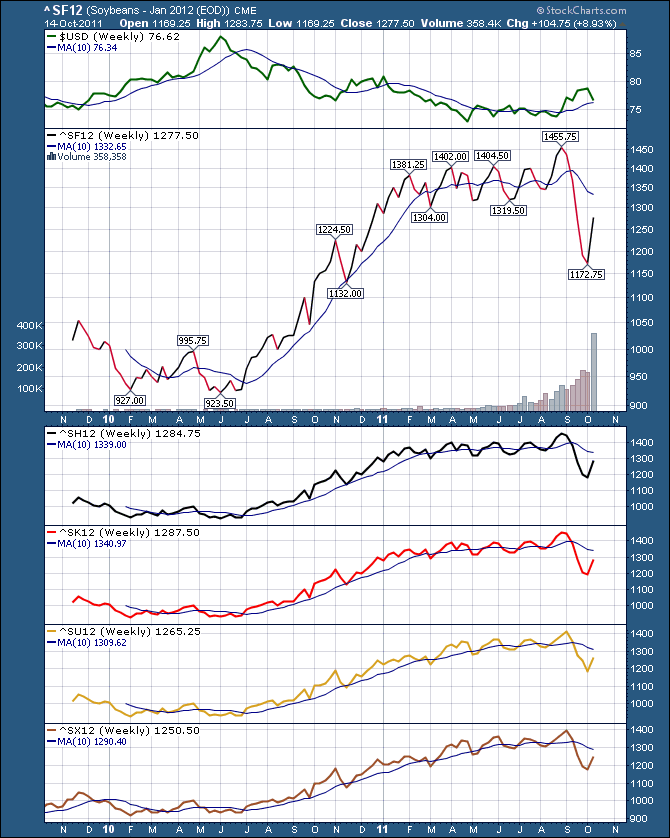
Below is Soybeans. It was doing quite well, but the start of September really pulled it back.
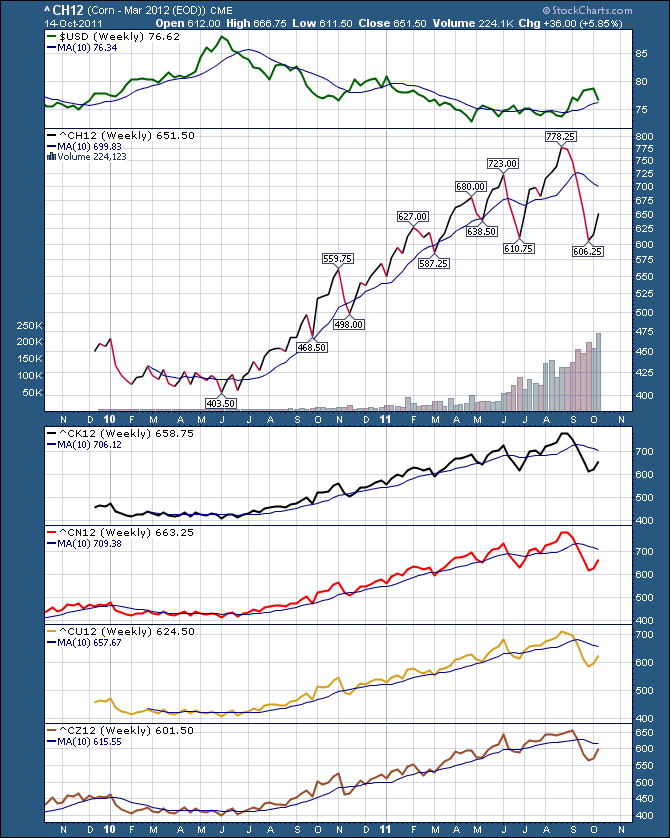
Here is Corn. Trading is getting wider and wider so I would suggest this uptrend is struggling to keep going.
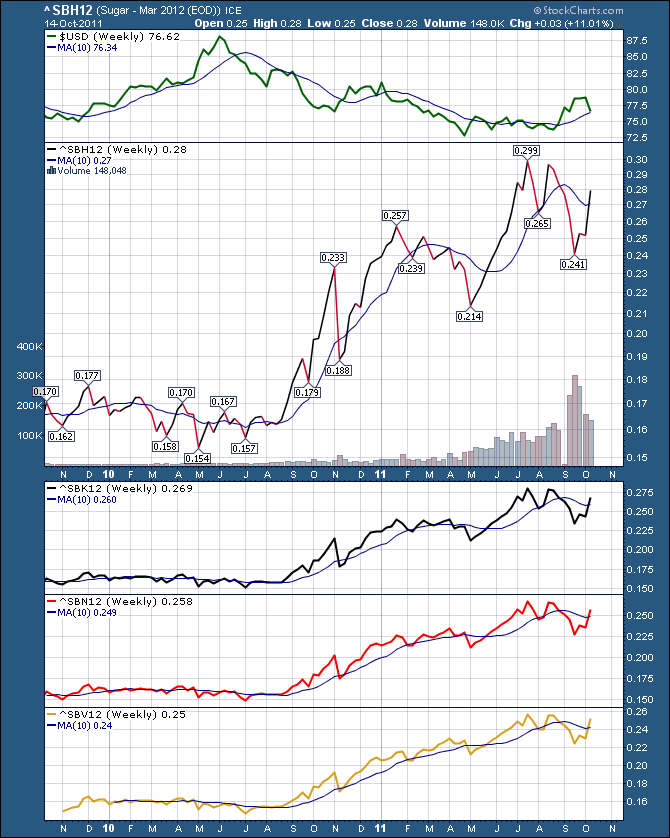
Here is the sugar chart.
Why do we care about these? What started the Arab Spring was a policeman pushed over an apple cart in Tunisia. As a protest to the high prices of food and the struggle of everyday, the cart vendor lit himself on fire and this started the Arab Uprisings or Arab Spring. When the $USD drops fast and for long periods, this really hurts low income countries. Food inflation is very difficult for every country, especially the 3rd world countries. Many people blame Ben Bernanke for this food inflation with the Fed policies. Whether they are right or wrong, it is important to watch what the consequences are in our food costs.
See a recent commentary about a Jim Rogers Interview here. He discusses stagflation, inflation and why this data is important to us.
We need to be keenly aware for what major trends will show up in our markets. If surging food commodities and bond yields are showing up, it helps us place our trades with the macro trends.
None of these charts look in sync here but we need to be aware if they all start to get above the 10 week line that the trade is starting to work. Only the sugar is currently above the 10 week. More on how to trade this macro trade in a future post.
Click on the pictures for a current chart you can work with that you can make larger. If you are in The Canadian Technician blog site, you can click on subscribe to get this message posted to your inbox, or use the RSS feed. You can also find it on stockcharts.com Facebook page. You need to be right inside the blog section, within The Canadian Technician Blog to see the subscribe button far right. Click here to go to the correct page.
Good Trading,
Greg Schnell, CMT


