This post is in response to some verbal, some email questions that have come from my previous posts. In posting my last few blogs, I added caution that tomorrow, Friday was OED (Option's Expiration Day) but it is different because it is during earnings season. Is it really different? I think it's really different.
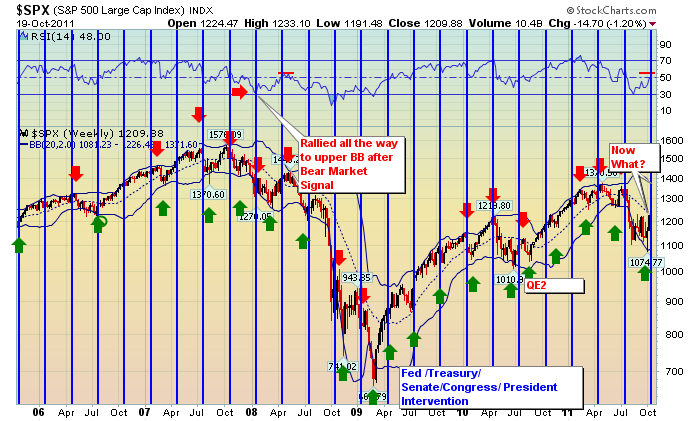
The first reason is my SPX graph below. I also showed this trend with the mining index and the NDX a week ago.
This is the main reason for my caution. Notice how close the red arrows that mark intermediate tops are to the blue lines. They are almost on top of them or sit just after the blue line. Essentially, the market rallies into option expirations. It corrects after earnings season, and then starts to rally into earnings season again. Notice how the green arrows are usually near the middle of the gap between options expiration. My 'from the hip' reasoning is that the market starts to anticipate earnings season. Once Earnings are out (and even Apple missed this time), why stay long? Move out and sell to the next owner, then move back in on weakness. Repeat. It's not perfect, but the trend is pretty strong. Notice the exceptions have been with QE2, TARP, QE1, etc. Is Operation Twist enough? As Donald Dony of the Technical Speculator mentioned, the most recent data is the most relevant.
Here is the $SPX. I encourage you to click on the chart to see the larger version.
The second thing to consider, notice how we are on the bottom of the dotted line that runs through the chart. It is a strong area of support on the way up and resistance on the way down. If we look to the left on the chart and we see where the market broke down in 2007 and the RSI went down to 30 (Start of a bear market signal), it capped moving back up at an RSI less than 60 (under the red line).
Currently we have registered a 30 RSI. These are rare. About 7 of them in the last 20 years. I encourage you to expand the chart to 20 years and look at the lows and how they proceeded. The one in 1994 took 6 months after the signal to start to rally. The question we must ask is " is this like 1994, 1997, 2001, 2007? In 2001, it was capped by the centre of the weekly BB. Is the 17 country Euro soveriegn debt crisis as big as the Tech wreck or the bank bust?
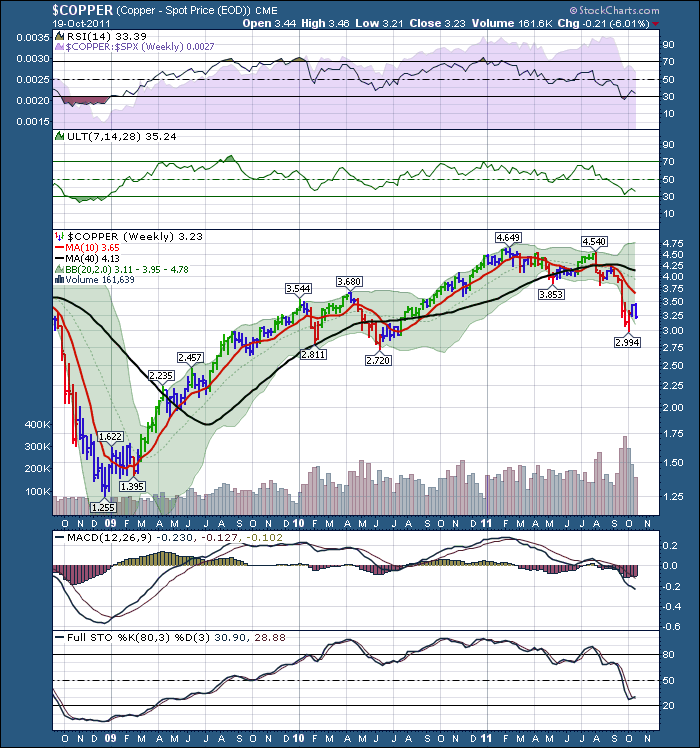
Here is $COPPER. It has struggled to get through the $3.70 resistance line on the chart. Every day adds data.
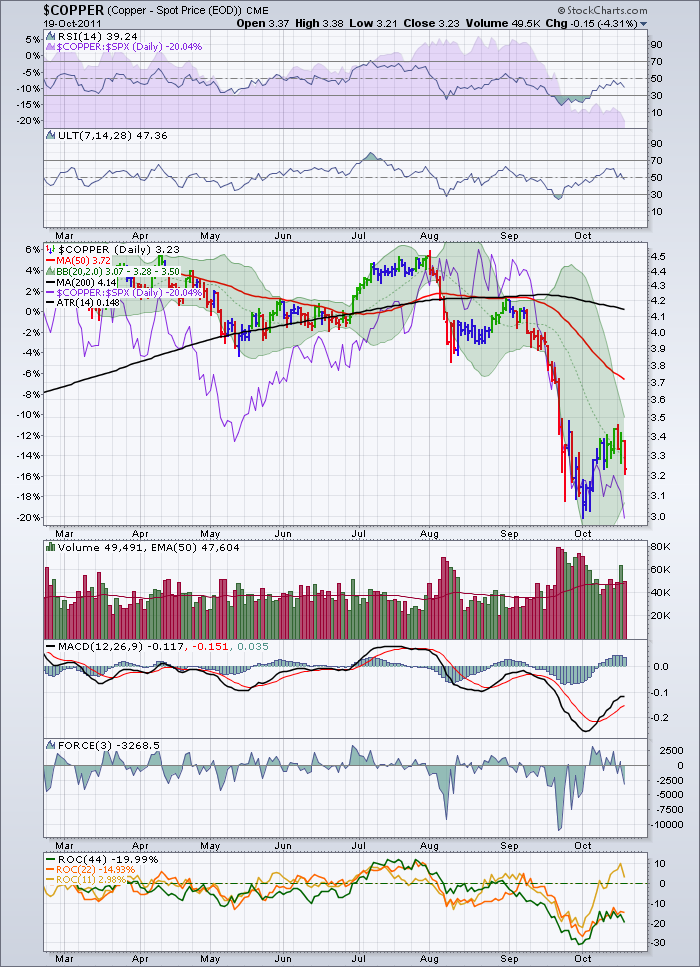
Here is Copper Daily:
The rate of change is still negative, and Copper has had 3 distribution days in the last 7.
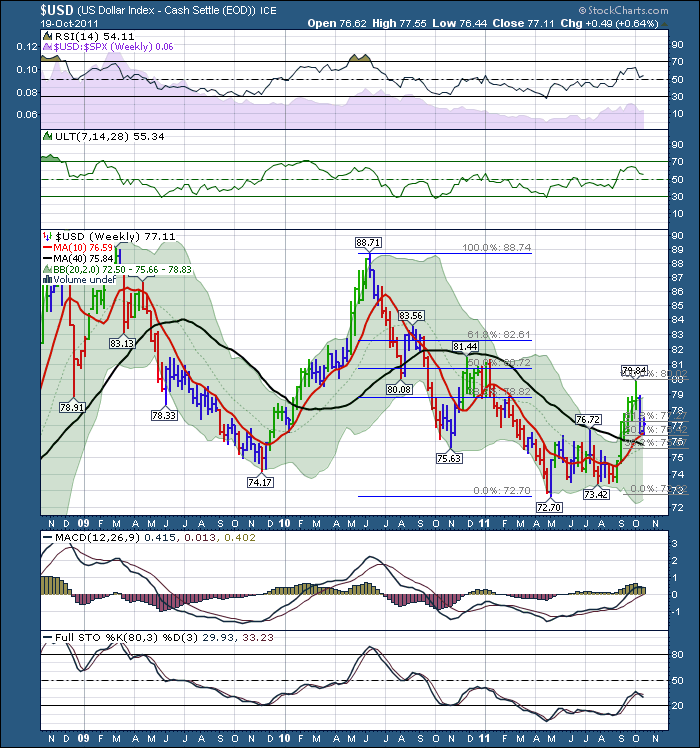
Let's check the $USD. It has retraced exactly 50% of it's move up. It bounced off it's 10 week or 50dma recently. It is in bullish mode. The MACD is above zero. On the daily chart the rate of change indicator is in bullish mode.
Gold seems to be releasing. Will it get support at $1545 which is the 200 dma?
OIl has held up well.
I want to be bullish here. I am concerned that UNA, WMT, RDSA.EU, XOM, are strong which is hardly who we want to see making breakouts off a 20% bear market low. We would probably expect funds to flow away from these companies if RISK ON was the direction of money flow.
Lastly,
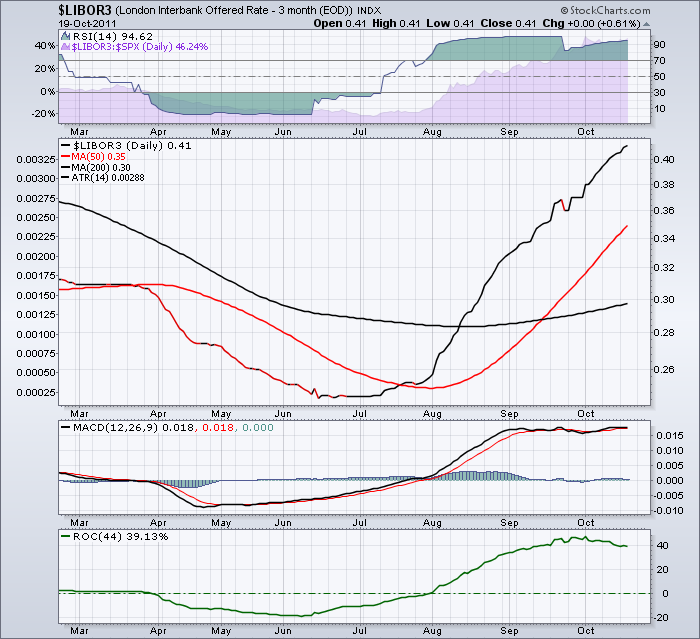
$LIBOR3 is still in bad shape. It continued to make new highs all through this rally. My understanding is this means banks that are lending to each other, are demanding higher rates as they are less sure of the counter party risk. Libor is above the 200 dma, and the 50 is above the 200. This would say we are in early days.
Does all this mean we are going lower? Well at lows, the charts always point lower. Currently we are up after a big 8% rally. So, I remain concerned and making sure the stops are tight.
It might take a few days to see how resilient the big money is in their positions.
One of the more bullish things (Maybe that's Sarcasm) is the number of cheerleaders that aren't very cheery. Mr. Carney, Bank of Canada Governor is very concerned of global systemic risk. That is not the type of commentary you would expect from one of the most respected bankers in the world. Flaherty (Canada's Finance Minsiter) wasn't at all bullish. The British finance minister as well as Merkel herself said the problems aren't going to be solved any time soon. One of her advisors said it would be next year before something final could happen. One of Obama's advisors said we are in early innings of this crisis today. Anthony Scaramucci was less positive than normal.There is a lot of ground to cover before this market will be excited but the charts will tell us first.
Lastly, I don't like when the growth market (the Nasdaq), was down 2.00% Wednesday and led the other indexes in terms of the size of decline. Both Monday and Wednesday were Distribution days.
Enough hurdles. Look for your shopping list, and hopefully we get to put it to work. But these earnings season OED's are very important in my mind.
Click here and go to the top right of the page if you would like to subscribe.
BIG NEWS : Tom Bowley of InvestEd Central is coming to Calgary! Watch for free registration news on this blog in the next few days. Mark your calendars for either session, November 5th 9:00 am or Tuesday November 8, 6:30 PM.
Good Trading,
Greg Schnell, CMT.

