Archived News
The Mindful Investor4mo ago
Can You Really Predict Stock Market Success Using the Yield Curve?
In this video, Dave reflects on the shape of the yield curve during previous bull and bear cycles with the help of StockCharts' Dynamic Yield Curve tool Read More
Add-on Subscribers
OptionsPlay with Tony Zhang4mo ago
Best Bullish and Bearish OptionsPlay Ideas for the Week!
In this video, Tony shows how he starts his week with a clear technical and fundamental perspective of the stocks he's likely going to enter, and of options positions throughout the week, and how you can apply that yourself Read More
Add-on Subscribers
OptionsPlay with Tony Zhang4mo ago
NVDA Stock Price Gives Bullish Signal: An Ultimate Options Strategy to Maximize Gains
As demand for advanced computing and artificial intelligence continues to surge, NVIDIA Corp. (NVDA) stands at the forefront of this revolution, with recent NVDA stock price action suggesting it may offer a compelling bullish opportunity Read More
DecisionPoint4mo ago
DP Trading Room: Swenlin Trading Oscillators Top!
On Friday our short-term Swenlin Trading Oscillators (STOs) turned down even after a rally Read More
GoNoGo Charts4mo ago
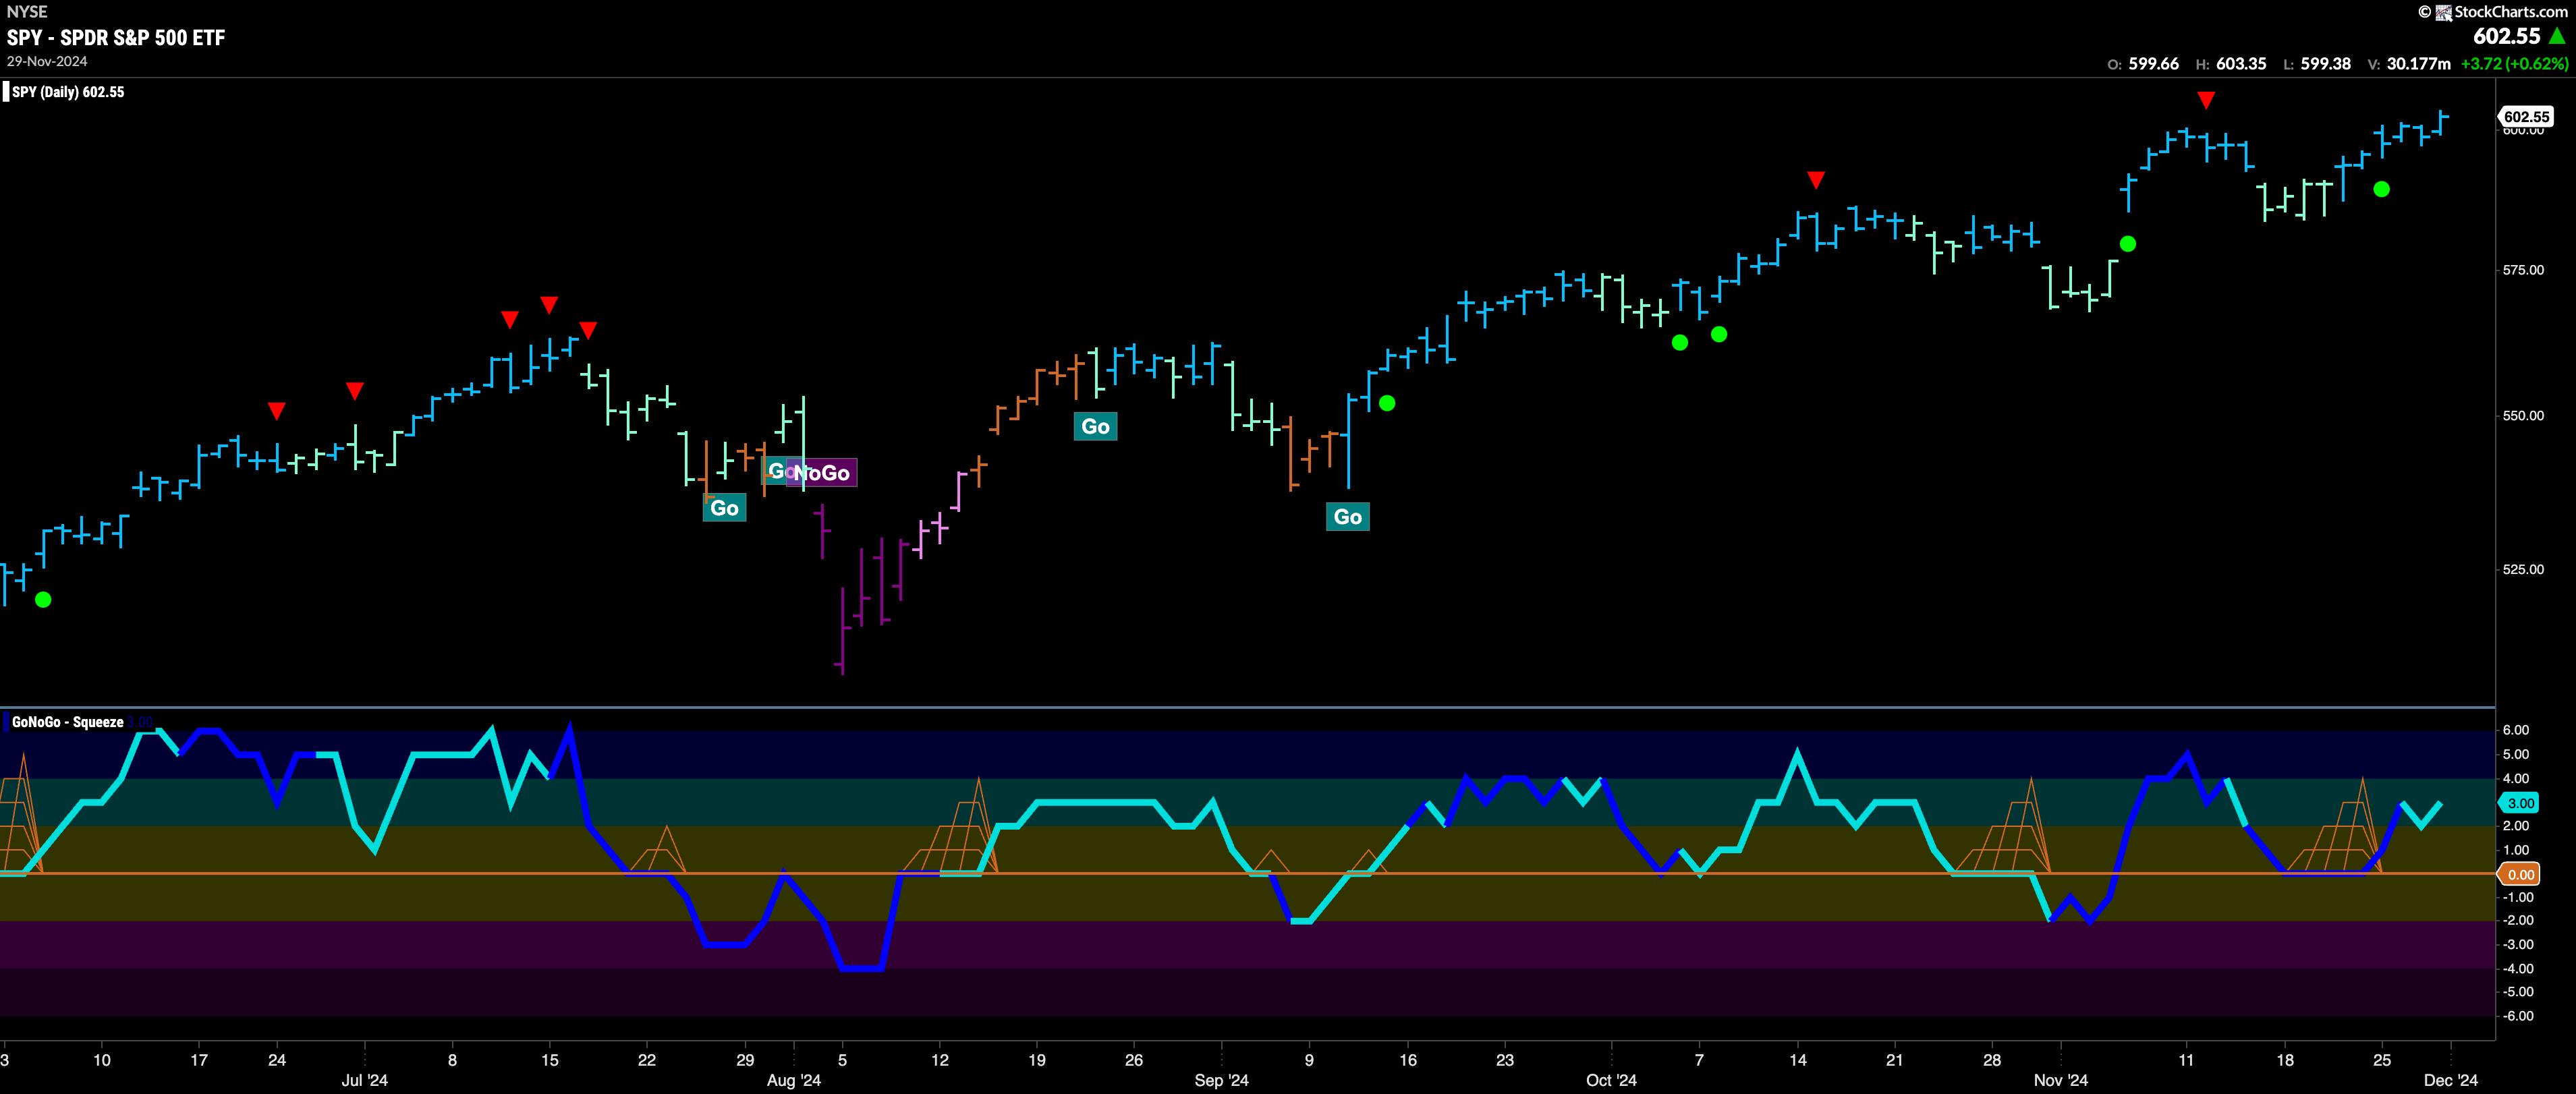
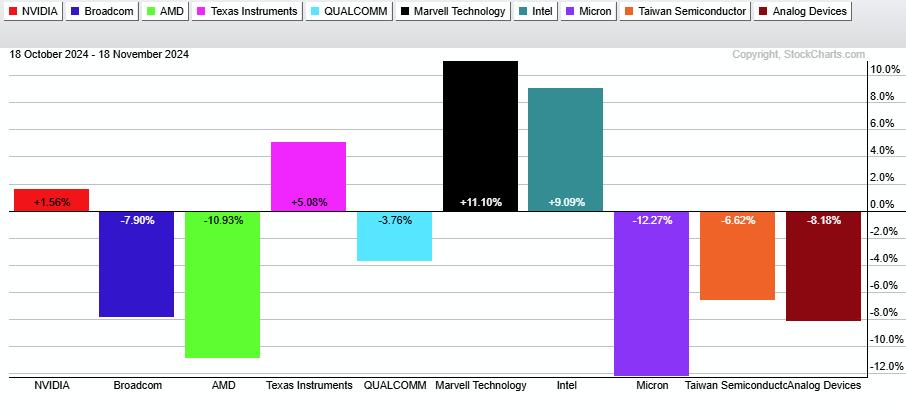
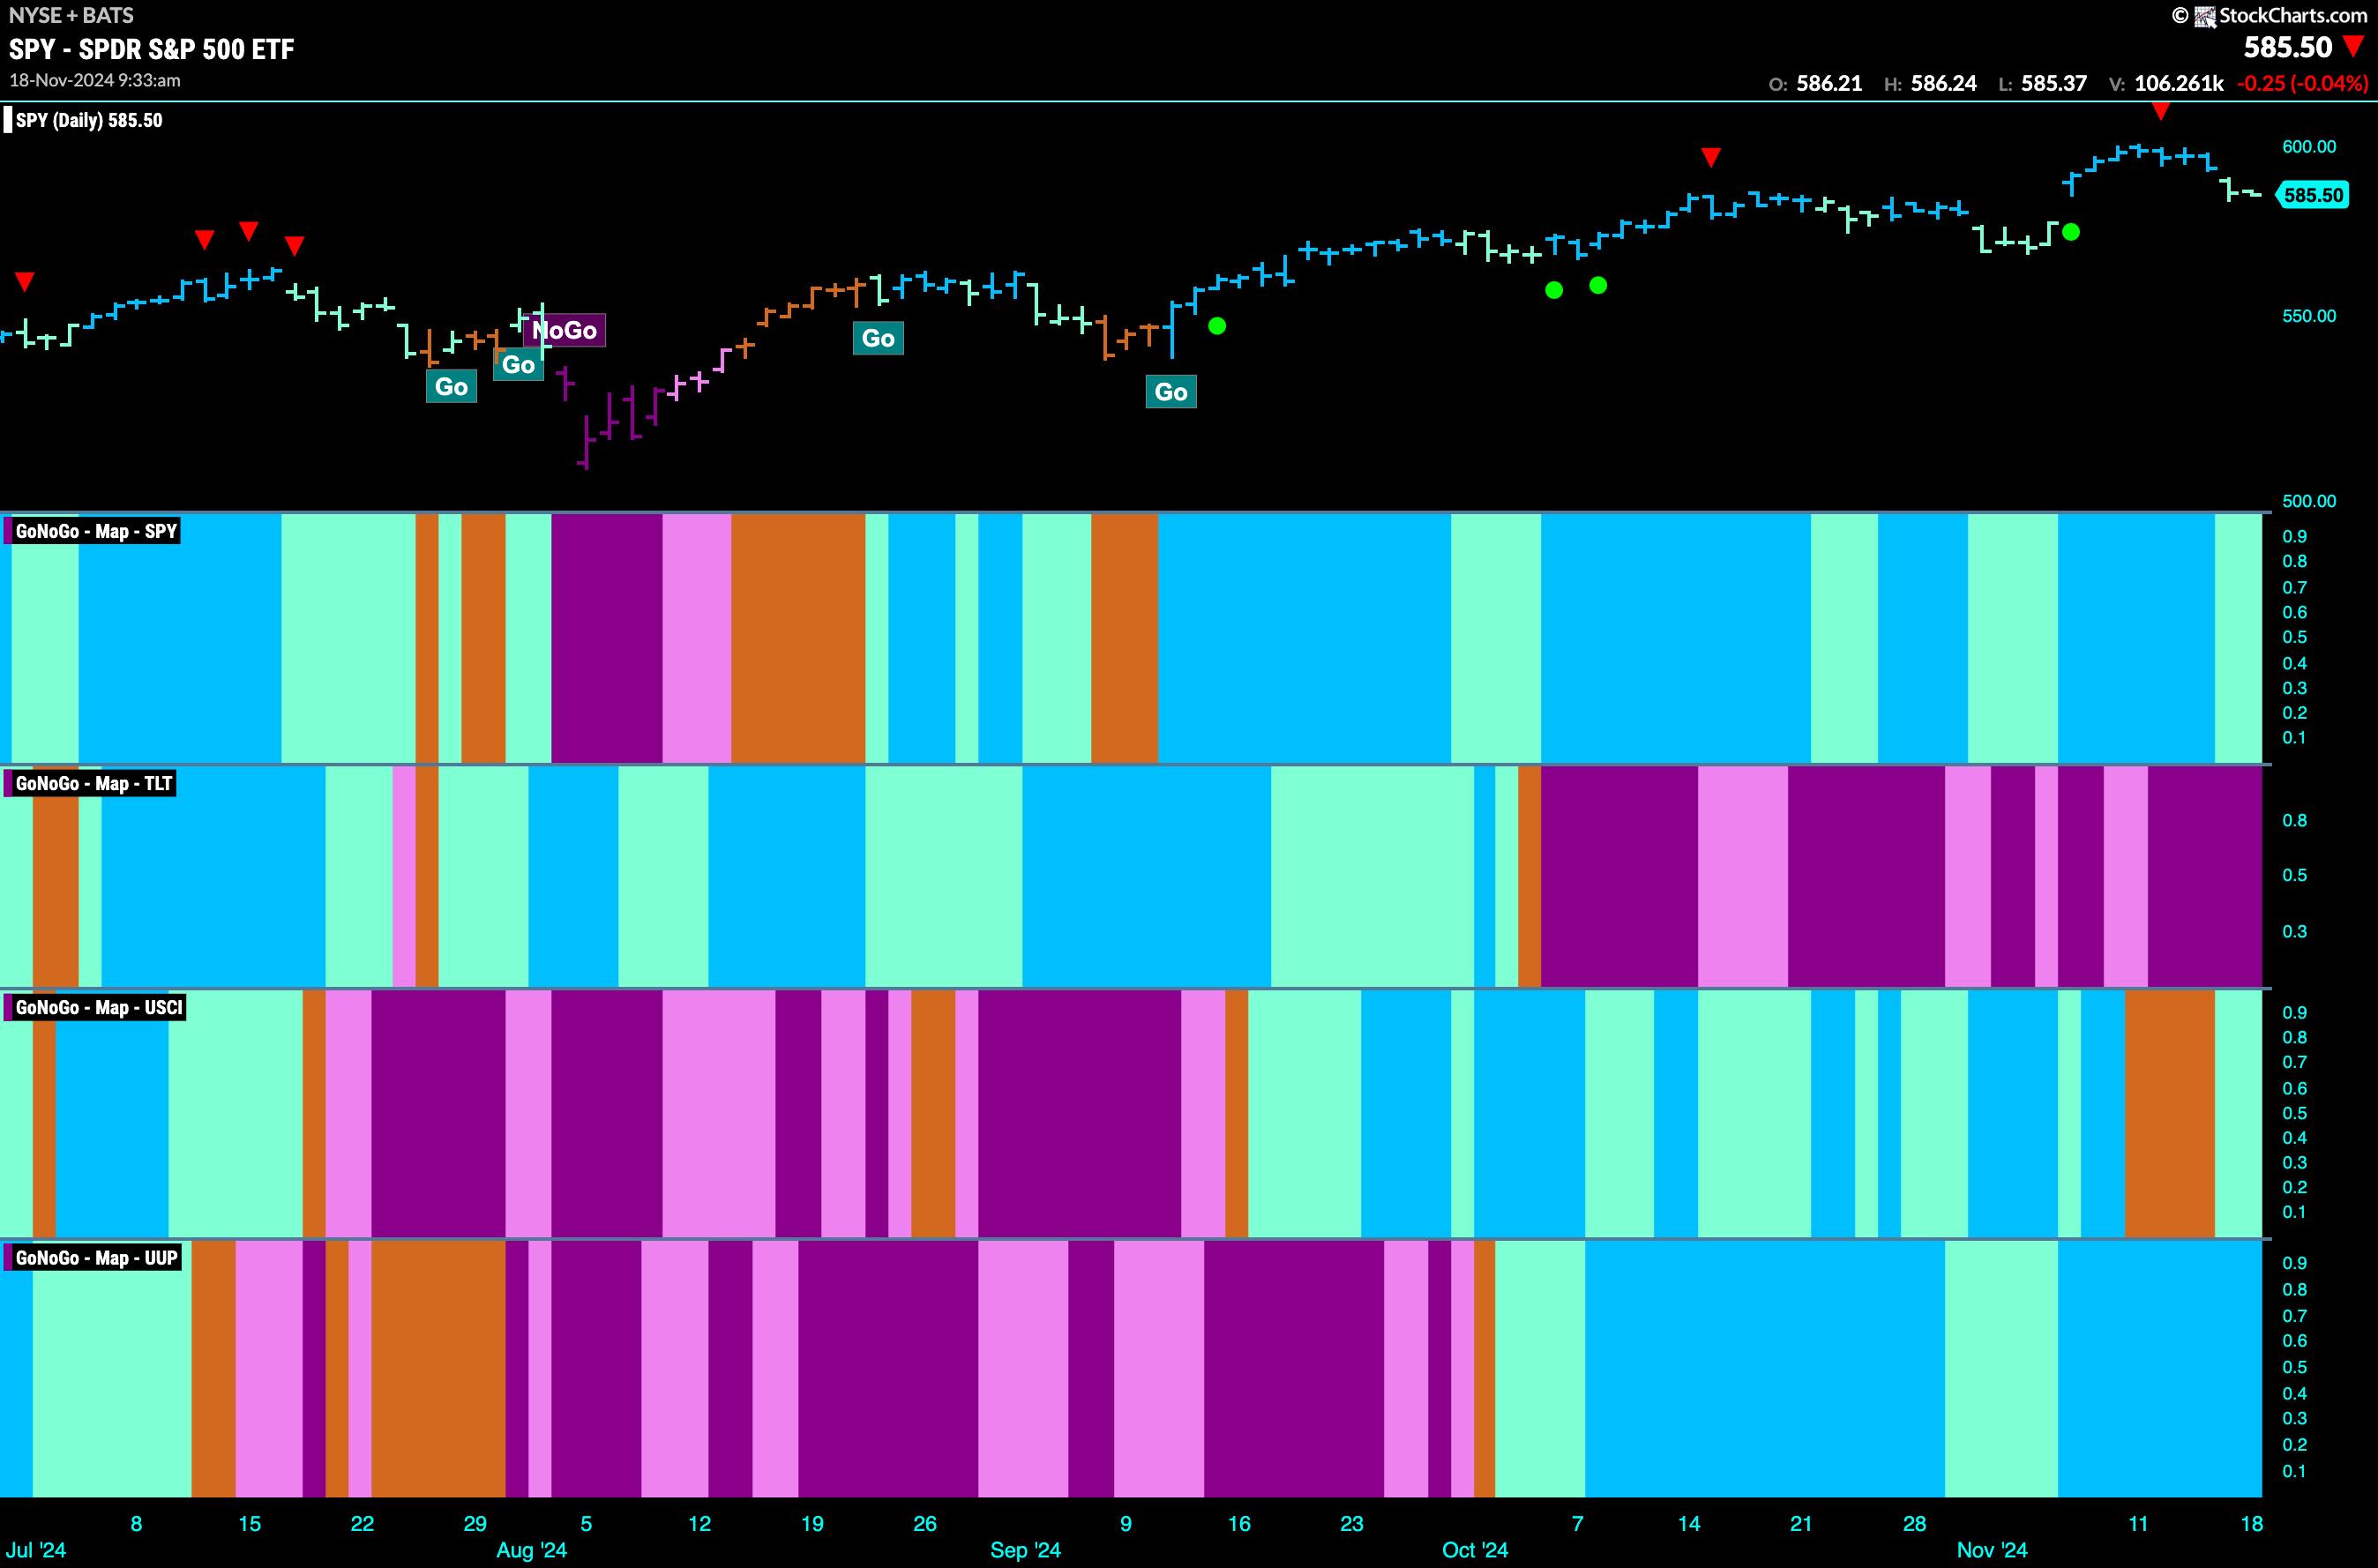
Equities Remain in Strong "Go" Trend, Edging Ever Higher
Good morning and welcome to this week's Flight Path. The "Go" trend in equities continues this week and we saw an uninterrupted week of strong blue bars. Treasury bond prices have seen a return to a "Go" trend with a pale aqua bar at the end of the week. U.S Read More
The Mindful Investor4mo ago
Five Ways You Should Use ChartLists Starting Today!
Having used many technical analysis platforms over my career as a technical analyst, I can tell you with a clear conscience that the ChartList feature on StockCharts provides exceptional capabilities to help you identify investment opportunities and manage risk in your portfolio Read More
ChartWatchers4mo ago

Navigating Holiday Stock Market Changes: Turn Sentiment Shifts into Successes
The day before Thanksgiving, the stock market took a little breather. But the weekly performance was still impressive. The Dow Jones Industrial Average ($INDU) remains the broader index leader, rising 0.96% for the week Read More
RRG Charts4mo ago
Can the S&P 500 Rally Without Tech?
In this video from StockCharts TV, Julius takes a deep dive into US sector rotation, breaking it down into offensive, defensive and cyclical sectors Read More
Trading Places with Tom Bowley4mo ago
Here's Why the Small Cap IWM Will Soar Nearly 70% by the End of 2025
If you want big returns, I'm convinced you'll find them in small caps. When I make bold predictions, and many of you know that I do fairly often, it's usually supported by long-term perspective Read More
Art's Charts4mo ago

Plunge in Treasury Yields Triggers Gap-Surge in Home Builders
The 10-yr Treasury Yield reversed its upswing with a sharp decline and the Home Construction ETF (ITB) reacted with a noteworthy gap-surge. Today's report analyzes the yield, the TBond ETF (IEF) and ITB Read More
Don't Ignore This Chart!4mo ago

How to Trade MicroStrategy's Painful Plunge: The Levels Every Investor Must Watch
On November 21, 2024, Citron Capital shorted MicroStrategy Inc. (MSTR). What made this confrontation particularly electrifying was the clash between two titans: Citron, a legendary short seller, and MicroStrategy, arguably the strongest stock of 2024 Read More
Members Only
Martin Pring's Market Roundup4mo ago
Three Charts That Could Be About to Break in a Big Way
This article is not centered around a specific theme; rather, it focuses on some charts which look as if they are about to signal an important change in trend. In this case, "important" is defined as a forthcoming move lasting at least 3-months Read More
Add-on Subscribers
OptionsPlay with Tony Zhang4mo ago
OptionsPlay: Macro Market Outlook and Options Strategies
Join Tony as he walks you through a Macro Market outlook, and shares his top bearish and bullish options trading ideas. He talks growth vs. value, commodities, bonds, the Dollar Index, sectors like homebuilders and semiconductors, and stocks like NVDA, DIS, INTC, and more Read More
The Mindful Investor4mo ago

Five Must-Have Tools for Analyzing Stock Charts
In this video, Dave shares how he uses the powerful ChartLists feature on StockCharts to analyze trends and momentum shifts as part of his daily, weekly, and monthly chart routines Read More
ChartWatchers4mo ago

Market Movements Today: Investors Rejoice as Stocks Rally, Bitcoin and Gold Backslide
It's a short trading week, and the stock market is rallying. It's clear that Wall Street liked President-elect Donald Trump's choice of Scott Bessent for Treasury Secretary Read More
Add-on Subscribers
OptionsPlay with Tony Zhang4mo ago
A Bullish Opportunity in CrowdStrike (CRWD) with OptionsPlay Strategy Center
As cyber threats continue to escalate globally, CrowdStrike Holdings, Inc. (CRWD) has emerged as a leading cybersecurity firm poised for significant growth Read More
GoNoGo Charts4mo ago

The Finances Look Good For Equity Trend
Good morning and welcome to this week's Flight Path. The "Go" trend in equities has proved to be resilient as we saw strong blue "Go" bars return this week. Treasury bond prices remained in a "NoGo" although this week we did see weaker pink bars as the trend showed weakness. U.S Read More
DecisionPoint4mo ago

Market Rally Broadens - New All-Time Highs?
Today Carl looks at the small-caps and mid-caps that have now begun to outperform the market. Clearly the rally is broadening, the question now is can we continue to make new all-time highs Read More
Trading Places with Tom Bowley4mo ago

Small and Mid Caps: Turning Lemons Into Lemonade
No matter how you slice it, small and mid caps have been absolutely crushed on a relative basis since 2021. The unfortunate part about this is that most traders have recency bias Read More
Analyzing India4mo ago
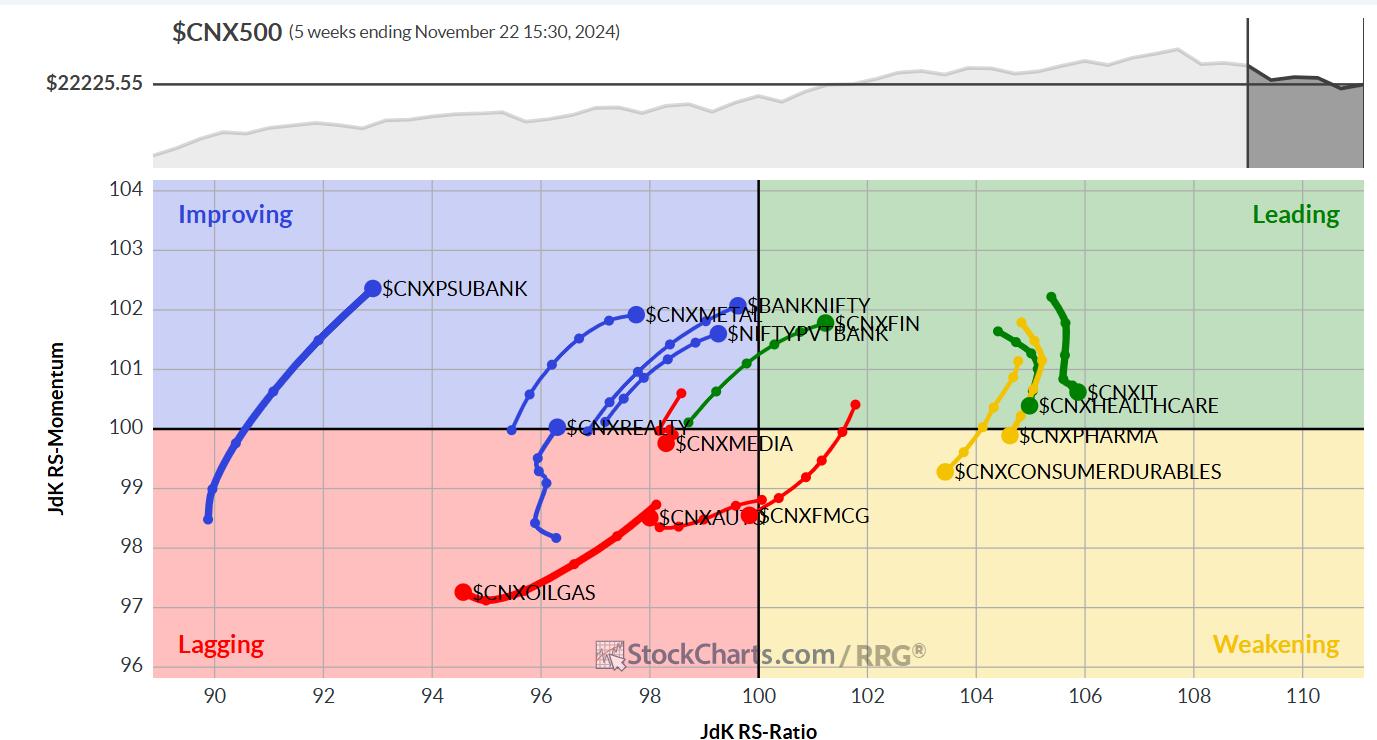
Week Ahead: NIFTY Defends This Crucial Support; Chase Rebounds Mindfully
In a truncated trading week, the Indian equities closed the week with gains thanks to a robust technical rebound that it witnessed on Friday Read More
The MEM Edge4mo ago
These Old-School Stocks Have Joined The AI Rally!
In this StockCharts TV video, Mary Ellen reviews the broad-based rally that pushed the Equal-Weighted SPX to new highs Read More
The Mindful Investor4mo ago

2024 is Shaping Up Like 2021, Which Did Not End Particularly Well
I've always found technical analysis to be a fantastic history lesson for the markets. If you want to consider how the current conditions relate to previous market cycles, just compare the charts; you'll usually have a pretty good starting point for the discussion Read More
ChartWatchers4mo ago

An All-Around Rally: Navigating Stocks, US Dollar, Gold, and Bitcoin Price Action
The last full trading week before the Thanksgiving holiday has ended on a positive note. Following up on yesterday's blog post, the S&P 500 Equal Weighted Index ($SPXEW) has continued to outperform the S&P 500's price action and hit a new all-time high Read More
Art's Charts4mo ago
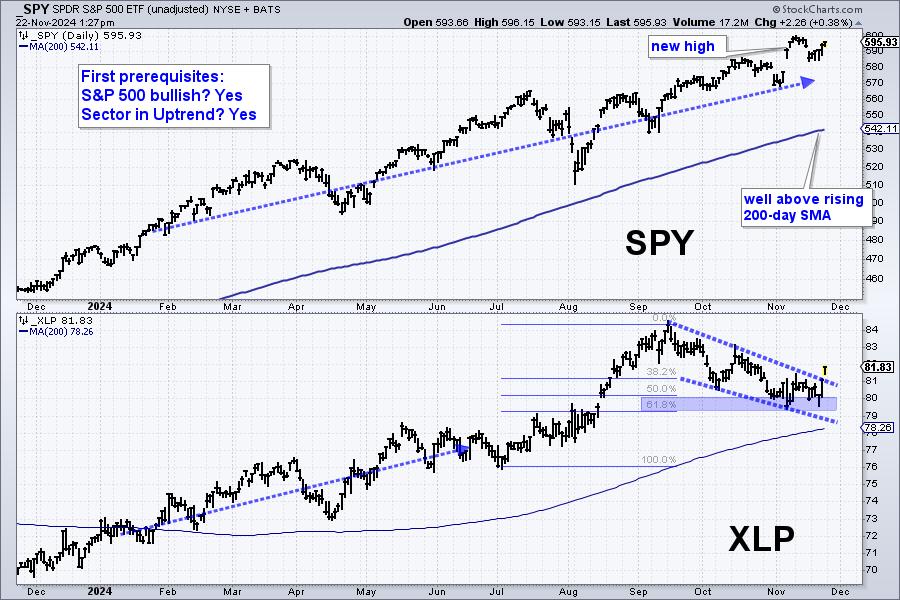
Four Prerequisites to Improve Your Odds - A Live Example
Even though trading based on chart analysis involves some discretionary decisions, chartists can improve the odds of success by systematizing their process. This report will show four prerequisite filters based on a top-down approach Read More
DecisionPoint4mo ago
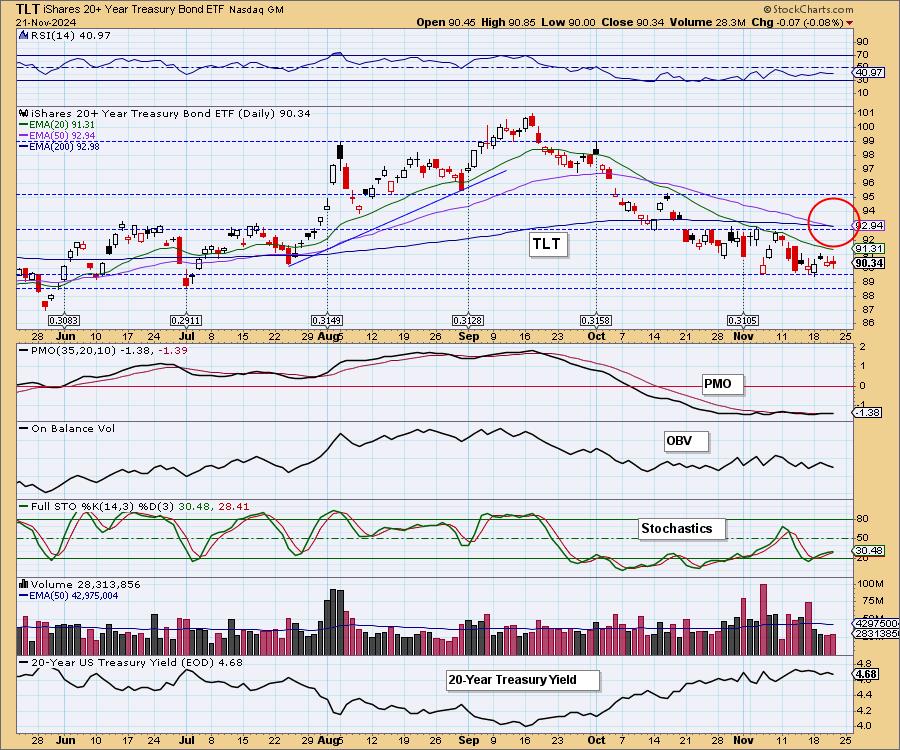
Bonds Get Death Cross SELL Signal
Today, the 20-Year Bond ETF (TLT) 50-day EMA crossed down through the 200-day EMA (Death Cross), generating an LT Trend Model SELL Signal. This was the result of a downtrend lasting over two months Read More
ChartWatchers4mo ago

Financial Upswing: Understanding the Stock Market Rally and Yield Rise
The afternoon turnaround seems to be more the norm than the exception. Thursday's stock market action followed the trend. What makes Thursday's turnaround more pronounced is a possible resumption of the uptrend in equities. But not all stocks are created equal Read More
Don't Ignore This Chart!5mo ago

AppLovin's 1,303% Rise: The Hidden Power of the SCTR Report
How do you find the next big stock before it gains the investing public's attention? It's tricky, but there are only two ways to spot a so-called "hot stock" before the social buzz Read More
RRG Charts5mo ago
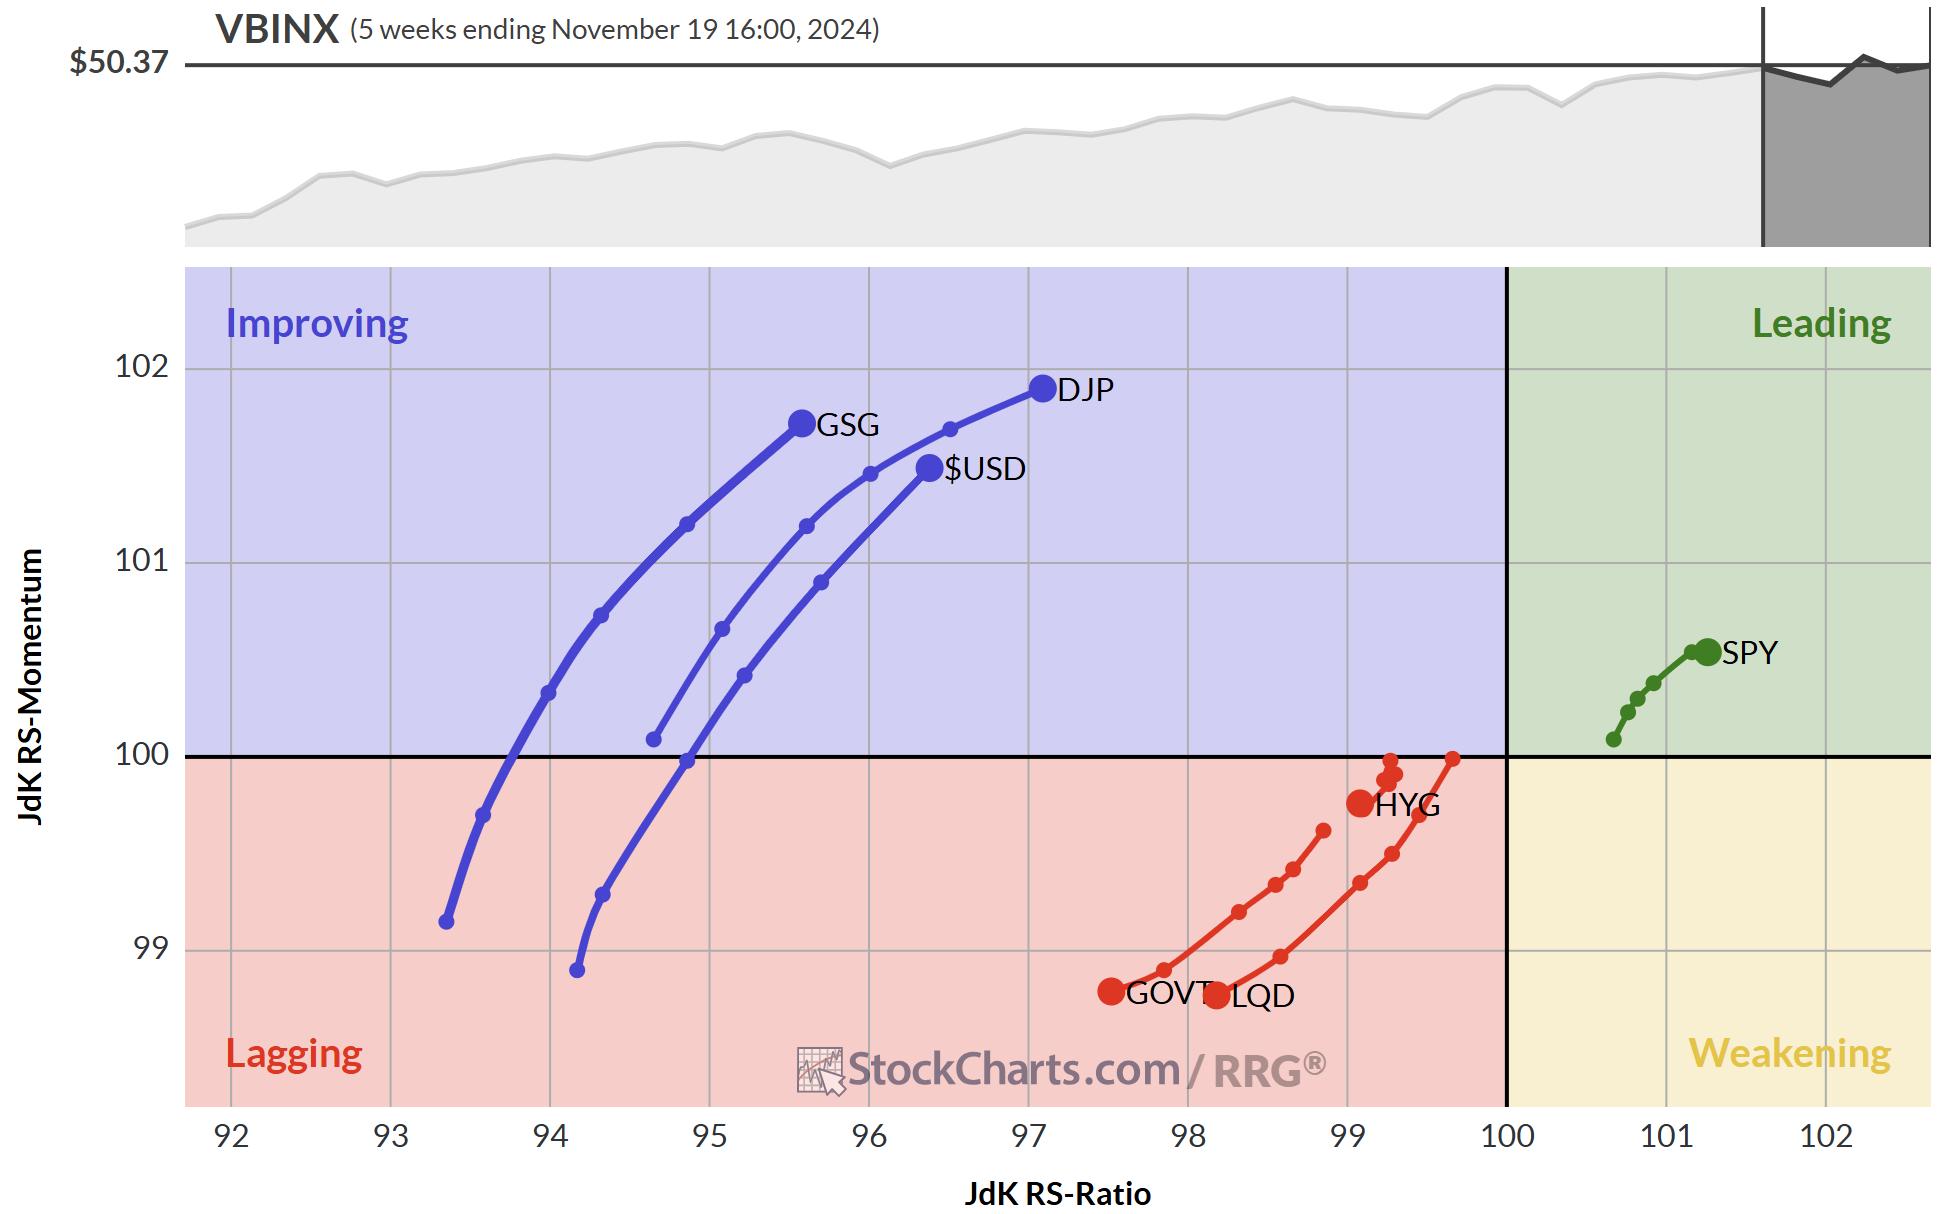
Is the USD Setting Up for a Perfect Rally?
After the election, things have hardly settled in the world. New developments in the Ukraine-Russian conflict and the Middle East are still volatile. Worst of all, I am in Redmond, WA this week, where last night's storm caused a massive power outage in this region Read More
Members Only
Martin Pring's Market Roundup5mo ago
These Country ETFs are Looking Particularly Vulnerable
Chart 1, below, compares the S&P Composite to the Europe Australia Far East ETF (EFA), which is effectively the rest of the world. It shows that US equities have been on a tear against its rivals since the financial crisis Read More
Stock Talk with Joe Rabil5mo ago
Be ALERT for Warning Signs - S&P 500 Downturn
In this exclusive StockCharts video, Joe goes into detail on the S&P 500 ETF (SPY), sharing why using MACD and ADX together can be beneficial -- especially in the current environment Read More
The Mindful Investor5mo ago

Sector Rotation Suggests Offense Over Defense
Institutional investors tend to focus heavily on relative strength; after all, this is essentially how they are evaluated in their performance as money managers! In this article, let's review three ways to analyze relative strength and what these charts are telling us about secto Read More
Don't Ignore This Chart!5mo ago

SCTR Report: The Palantir Trade Follow-Up—Transform Insights into Actions
There are times when the price action of a stock is worth analyzing further. This article is a follow-up to last week's StockCharts Technical Rank (SCTR) Report pick, Palantir Technologies (PLTR) Read More
The Mindful Investor5mo ago

Three Ways Top Investors Track Sector Rotation
In this video, Dave outlines three tools he uses on the StockCharts platform to analyze sector rotation, from sector relative strength ratios to the powerful Relative Rotation Graphs (RRG) Read More
Art's Charts5mo ago
A Tale of Two Semiconductor ETFs - Why is SMH holding up better than SOXX?
Even though the iShares Semiconductor ETF (SMH) and the VanEck Semiconductor ETF (SOXX) have many similarities, there are some big differences in their component weightings and performance. Namely, SMH allows more concentration than SOXX and SMH is holding up better than SOXX Read More
Add-on Subscribers
OptionsPlay with Tony Zhang5mo ago
Macro Market Outlook and Best Options Trade Ideas!
Join Tony as he walks you through a Macro Market outlook, where he shares his top bearish and bullish options trading ideas, These include Disney (DIS), Shopify (SHOP), Intel (INTC), Adobe (ADBE), and Apple (AAPL). He explores growth vs Read More
ChartWatchers5mo ago

MarketCarpets Secrets: How to Spot Winning Stocks in Minutes!
When looking for stocks to invest in, spotting strong stocks in promising sectors poised to bounce can be tricky and complicated Read More
DecisionPoint5mo ago

Stocks: "...a PERMANENTLY high plateau"?
Today we explore the bullish sentiment that has taken SPX valuations to the moon. There are many out there that believe we have hit a plateau on prices that will continue permanently Read More
GoNoGo Charts5mo ago
Equities Look for "Energy" in "Go" Trend
Good morning and welcome to this week's Flight Path. Equities saw the "Go" trend continue this week but we saw weaker aqua bars at the end of the week. Treasury bond prices painted strong purple "NoGo" bars as the weight of the evidence suggested the "NoGo" will continue. U.S Read More
Trading Places with Tom Bowley5mo ago

3 Breakouts Ready for Massive Climbs!
As the secular bull market takes a short-term pause, now is the time to research tremendous opportunities that lie ahead Read More
The MEM Edge5mo ago
Don't Miss These Breakouts Poised to Trade Higher!
In this StockCharts TV video, Mary Ellen reveals what took place last week and how the markets closed. She also revealed what drove price action, and what to be on the lookout for next week. In addition, she shares several stocks that broke out of powerful bases on bullish news Read More
Popular Articles

This is the Group to Watch for the Next Bull Market Phase and Separating Noise from Reality

The Bottom is Here or Rapidly Approaching

An Oversold Bounce is One Thing - A Bullish Breadth Thrust is Another

When in Doubt, Follow the Leadership

Bullish Percent Index Confirms Short-Term Rebound

200-Day Moving Average Confirms Bearish Phase
Get expert technical commentary delivered straight to your inbox! Sign up for our FREE weekly ChartWatchers Newsletter. Learn More
Featured Authors


Public ChartList Leaders


StockCharts Members unlock complete access to the Stocks & Commodities Magazine archives. Read the latest articles or browse past editions.