Archived News
ChartWatchers10mo ago

S&P 500 Still Bullish: This Is What You Should Watch For
It was a bit of a seesaw week in the stock market, but, overall, the market seems to think everything is looking good. The May employment report indicated that the change in Non-Farm Payrolls (NFP) was stronger than expected Read More
RRG Charts10mo ago

Only One Pocket of Strength Left in US Stock Market
Breaking Down Into Growth / Value Using Relative Rotation Graphs to help break down the US stock market into various segments can help us identify pockets of strength or weakness. In this first RRG below, we can examine the relationship between value and growth stocks Read More
DecisionPoint10mo ago

Technology Sector Participation Is Fading
The Technology Sector (XLK) continues to dominate and drive the rally, but fewer and fewer stocks within the sector are participating in the rally Read More
Don't Ignore This Chart!10mo ago

Retail Stocks Caught in Limbo: Will RTH Break Free and Soar?
VanEck Vectors Retail ETF (RTH) is a peculiar beast. It holds 26 retail stocks, 70% in the Consumer Discretionary sector and 30% in Consumer Staples Read More
Dancing with the Trend10mo ago
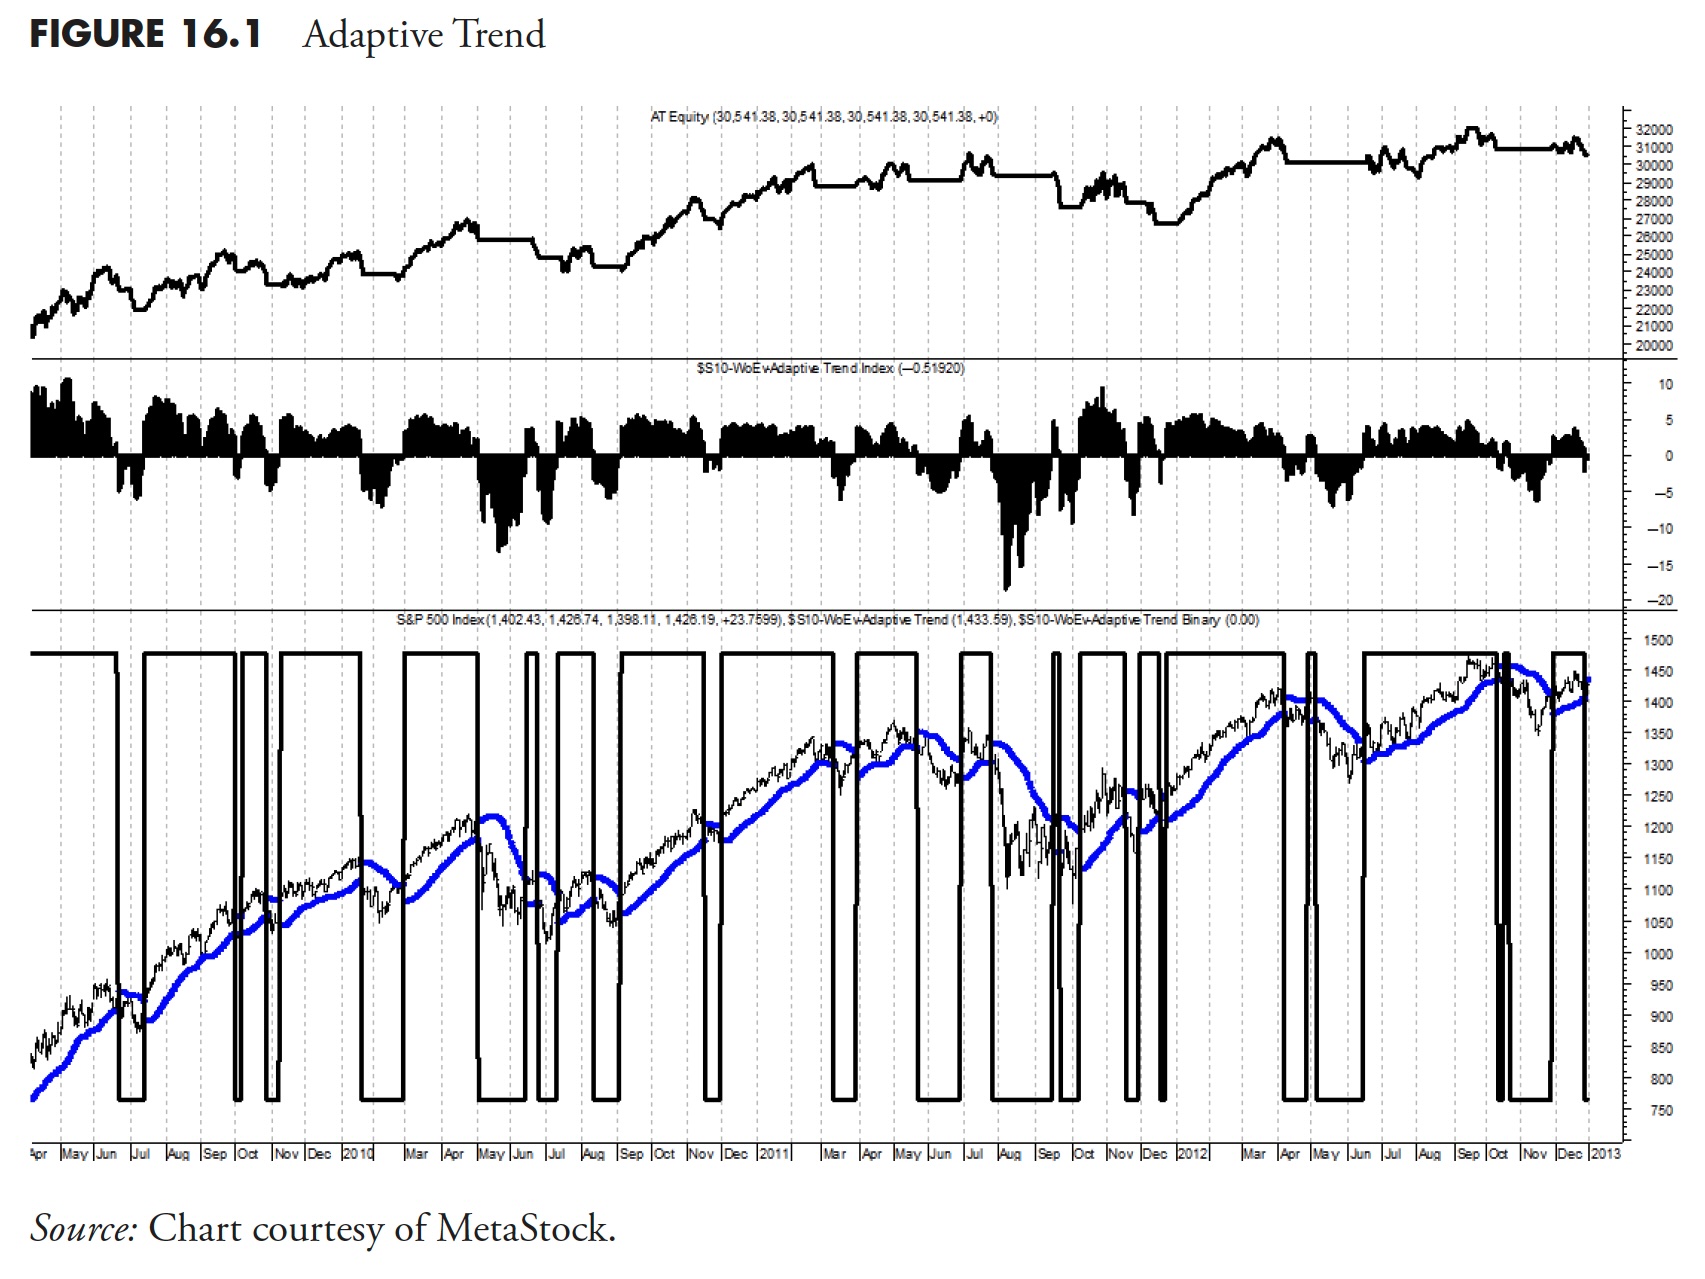
Rules-Based Money Management - Part 8: Putting Trend-Following to Work
Note to the reader: This is the twenty-fourth in a series of articles I'm publishing here taken from my book, "Investing with the Trend." Hopefully, you will find this content useful Read More
Stock Talk with Joe Rabil10mo ago

3 Keys to Finding the Strongest Trends
On this week's edition of Stock Talk with Joe Rabil, Joe shows the three keys he hunts for when identifying reversals and strong trends, giving a few examples and then showing one that is developing now. He then highlights similar techniques he uses while reviewing the Sectors Read More
Don't Ignore This Chart!10mo ago

Will Spotify Smash Its All-Time High of $387?
Music streamer Spotify Technology (SPOT) isn't a cheap stock. But it might not be considered overvalued either, despite its earnings having been rather "spotty" (pardon the pun) and dipping into negative territory before last October Read More
Add-on Subscribers
OptionsPlay with Tony Zhang10mo ago
A Practical Options Strategy to Trade Home Depot
America's largest home improvement store, Home Depot, Inc. (HD), has benefited from a long period of investor interest and traded at a premium valuation for several years Read More
RRG Charts10mo ago

These SURPRISING Sectors are Showing Strength
In this video from StockCharts TV, Julius uses the S&P 500 Sector Indexes to assess the long term price trends on the completed monthly charts for May, then discusses the long-term relative trends on a monthly RRG Read More
Members Only
Martin Pring's Market Roundup10mo ago
It's Time to Take a Look at the Canadian and Australian Dollars and What They Imply for Inflation
The Canadian and Aussie dollars have been confined between two converging trendlines since the beginning of the century, as we can see from Chart 1. The moment of truth appears to be close at hand, as both are approaching the apex of a giant potential symmetrical triangle Read More
Wyckoff Power Charting10mo ago

Wyckoff at Work in the Intraday Timeframe
It is well known that stock market indexes are fractal. Demonstrating repeatable price structures in all timeframes. In the intraday timeframe these price structures repeat frequently Read More
GoNoGo Charts10mo ago

UTILITIES TRYING TO "POWER" UP EQUITY MARKETS
Good morning and welcome to this week's Flight Path. We saw continued weakness this week in U.S. equities although there was a big rebound on Friday's bar. Treasury bond prices entered a period of uncertainty as we see GoNoGo Trend paint successive amber "Go Fish" bars. The U.S Read More
DecisionPoint10mo ago

DP Trading Room: Upside Initiation Climax (Should We Trust It?)
On today's DecisionPoint Trading Room episode Carl and Erin discuss Friday's "Upside Initiation Climax" and whether it can be trusted. With market follow through tepid, they discuss the implications of this very bullish signal Read More
Art's Charts10mo ago

Visualizing the Holdings for a Dual Momentum Rotation Strategy
As the name suggests, Dual Momentum Rotation Strategies focus on stocks that are in absolute and relative uptrends. This is a two-step process. First, filter out stocks that are in long-term downtrends and only focus on stocks in uptrend Read More
Analyzing India10mo ago
Week Ahead: Markets' Reaction to Exit Poll and General Election Results
The Indian equities experienced a notably eventful previous week, marked by a fresh lifetime high and a subsequent decline of over 400 points within the same week. Over the past five sessions, the Nifty 50 index fluctuated within a 693 Read More
Trading Places with Tom Bowley10mo ago

One MAJOR Concern About Friday's Rally
I'm all for a big rally with a hammer printing on the long-term weekly chart, especially at 20-week EMA support. That's exactly what happened on Friday on the Dow Jones Industrial Average ($INDU) Read More
The Mindful Investor10mo ago

Hindenburg Omen Flashes Initial Sell Signal
While the S&P 500 did manage to finish the week above tactical support at 5250, one of the most widely-followed macro technical indicators recently registered an initial sell signal for the second time in 2024 Read More
GoNoGo Charts10mo ago

Top 5 Stocks in "Go" Trends | Fri May 31, 2024
Top 5 Stocks in "Go" Trends Trend Continuation on Rising Momentum GoNoGo Charts® highlight low-risk opportunities for trend participation with intuitive icons directly in the price action Read More
The MEM Edge10mo ago

Tech Stocks Sell Off, But AI Shines!
In this episode of StockCharts TV's The MEM Edge, Mary Ellen reviews the bullish close in the markets while highlighting areas to stay away from. She also shares why AI-related areas of Tech remain positive and what drove the Retail sector into a new uptrend Read More
ChartWatchers10mo ago

Stock Market Shows Its Magic: An Exciting Finish
What a turnaround! Today's PCE data, which was in line with expectations, initially sent the stock market higher. Then, it experienced a significant selloff, but things changed in the last 30 minutes Read More
The Final Bar10mo ago

MUST SEE! Top 10 Stock Picks For June 2024
In this edition of StockCharts TV's The Final Bar, join Dave and Grayson as they run through top 10 charts to watch in June 2024! They'll cover breakout strategies, moving average techniques, relative strength, and much more Read More
Don't Ignore This Chart!10mo ago

Is Aflac Set to Surpass Analysts' Targets? Find Out Now!
Boring and captivating rarely coexist, except for contrarians who can uncover the subtle allure in what the mainstream finds mundane. Yet discovering the next "hot" stock often demands looking at assets the popular crowd undervalues and ignores Read More
DecisionPoint10mo ago

Textbook Double Top on Silver (SLV)
Gold is struggling, moving mostly sideways. Silver has technically been moving sideways as well, only it has formed a textbook double top chart pattern. Textbook double tops show even tops and a clear confirmation line delineated at the middle of the "M" formation Read More
Members Only
Larry Williams Focus On Stocks10mo ago
The Sky is Not Falling | Focus on Stocks: June 2024
The Final Bar10mo ago

S&P 500 Sinks on Software and Semiconductor SELLOFF
In this edition of StockCharts TV's The Final Bar, Dave welcomes Jonathan Krinsky, CMT of BTIG. Jonathan speaks to the weakness in market breadth conditions and the software group as a key space to watch for relative strength weakness Read More
ChartWatchers10mo ago

From Summer Doldrums to Year-End Surge: How to Profit from Seasonal Trends in Precious Metals and Bitcoin
Safe-haven investments like gold, silver, and now Bitcoin have had a bumpy and uncertain rise, but they've all ascended despite mixed opinions from analysts Read More
Dancing with the Trend10mo ago

Rules-Based Money Management - Part 7: The "Dancing with the Trend" Model
Note to the reader: This is the twenty-third in a series of articles I'm publishing here taken from my book, "Investing with the Trend." Hopefully, you will find this content useful Read More
The Final Bar10mo ago

Failed Bearish Patterns are Bullish for S&P 500!
In this edition of StockCharts TV's The Final Bar, Dave welcomes Frank Cappelleri, CMT CFA of CappThesis. Frank shares how the bull market phase has been marked by confirmed and completed bullish patterns and failed breakdowns after bearish patterns Read More
Stock Talk with Joe Rabil10mo ago

This MUST SEE MACD Pattern is a Game Changer
On this week's edition of Stock Talk with Joe Rabil, Joe shows a specific MACD pattern that, when it develops on the monthly chart, can give a great early warning sign. Joe gives several examples of this pattern during the lesson Read More
Analyzing India10mo ago
Market Analysis: Top Stock Picks and Sector Insights
As we approach the highly anticipated results of India's general elections on Tuesday, June 4, market volatility is expected to be at its peak Read More
The Final Bar10mo ago

Three Stock Ideas as S&P 500 Treads Water
In this edition of StockCharts TV's The Final Bar, Dave welcomes Tony Zhang of OptionsPlay. Tony shares three stock ideas showing favorable risk/reward characteristics as the S&P 500 index treads water above support at 5250 Read More
RRG Charts10mo ago
What Happens to GOOGL When This Negative Divergence Executes
In this video from StockCharts TV, Julius takes a look at the differences in rotation between cap-weighted and equal-weighted sectors and sees a warning signal for GOOGL. He also examines the Communications Sector vs. the Equal-Weighted ETF Read More
GoNoGo Charts10mo ago
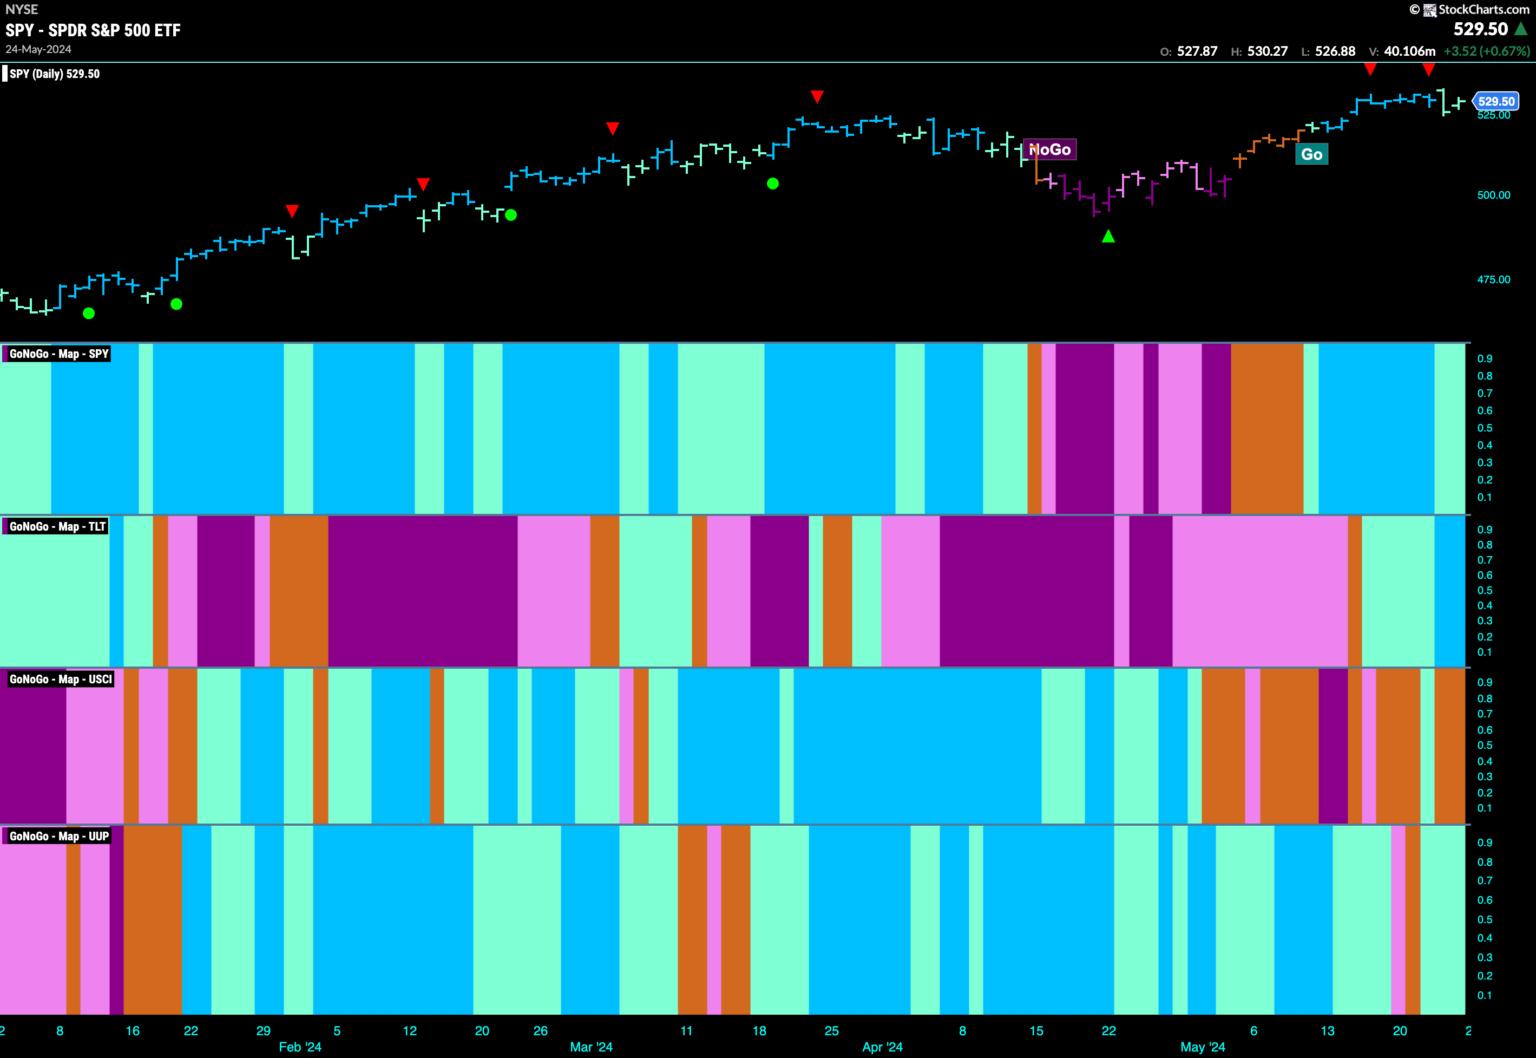
EQUITIES REMAIN IN "GO" TREND WITH SPARSE LEADERSHIP FROM TECH AND UTILITIES
Good morning and welcome to this week's Flight Path. We saw some weakness this week as price pulled back a little from all time highs. Momentum cooled, we saw this in the form of Go Countertrend Correction Icons (red arrows) and GoNoGo Trend painted weaker aqua bars Read More
Trading Places with Tom Bowley10mo ago

Here Are 4 Steps To Improve Your Trading Process and Results
Let's jump right in. For me, everything starts at the TOP. I take a top-down approach to trading. And when I say "the TOP", I mean market direction. Step 1: Is it a Bull or Bear Market? Listen, this is a very easy step to me. Look at a LONG-TERM chart of the S&P 500 Read More
StockCharts In Focus10mo ago

This Simple Little Option Is A HUGE Productivity Booster
On this week's edition of StockCharts TV's StockCharts in Focus, Grayson shows you how to boost your charting workflow with the "Inspect" tool Read More
Analyzing India11mo ago

Week Ahead: NIFTY Set to Move Within This Volatile Range; Curtailing Leveraged Exposures is Recommended
It was a truncated day for the markets; over the past four trading sessions, the Indian equities continued to edge higher and ended on a fresh lifetime high. The volatility, too, remained at elevated levels Read More
The MEM Edge11mo ago

MEM TV: How to Trade Nvidia After Its 15% Gain
In this episode of StockCharts TV's The MEM Edge, Mary Ellen reviews the broader markets and the rotation that's taking place amid a rise in interest rates. She also takes a close look at NVDA and shares how you should handle the stock after last week's 15% gain Read More
The Final Bar11mo ago

Technical Indicator Showdown: MACD vs. PPO vs. PMO
In this edition of StockCharts TV's The Final Bar, Dave answers viewer questions from The Final Bar Mailbag Read More
ChartWatchers11mo ago

Stock Market Ends Week on Optimistic Note, With a Few Surprises
It was a roller-coaster week in the stock market, a reminder that, when markets are trading at their all-time highs, it pays to be cautious. Any negative news can trigger emotions, resulting in a domino effect reaction Read More
RRG Charts11mo ago

Surge in TSLA and Strong AMZN Not Enough
Concerns Remain My concerns about current market developments, which I voiced in last week's article, are still valid. The current sector rotation, as it is visible on the relative rotation graph above, is not supportive of a strong rise in the S&P 500 Read More
Popular Articles

This is the Group to Watch for the Next Bull Market Phase and Separating Noise from Reality

When in Doubt, Follow the Leadership

200-Day Moving Average Confirms Bearish Phase

Stay Ahead of the Stock Market: Key Bond Market Signals Explained with Charts

Equities? Fuhgeddaboudit! Alternative Assets are Leading

Is This the Confidence Trap That Could Wreck Your Retirement Portfolio?
Get expert technical commentary delivered straight to your inbox! Sign up for our FREE weekly ChartWatchers Newsletter. Learn More
Featured Authors


Public ChartList Leaders


StockCharts Members unlock complete access to the Stocks & Commodities Magazine archives. Read the latest articles or browse past editions.