Archived News
DecisionPoint8mo ago

DP Trading Room: Potential Housing Crash?
Today Carl and Erin discuss the potential of a housing crash as more evidence is coming in that many haven't thought of. Private Equity firms have become very involved in the housing market, buying up properties on high amounts of leverage Read More
The MEM Edge8mo ago

These Groups Just Turned BULLISH!
In this StockCharts TV video, Mary Ellen highlights what drove last week's sharp rally in the markets - posting their largest weekly gains for the year! She takes a close look at retail and cybersecurity stocks setting up for gains, and shares some of the best ways to participate Read More
GoNoGo Charts8mo ago
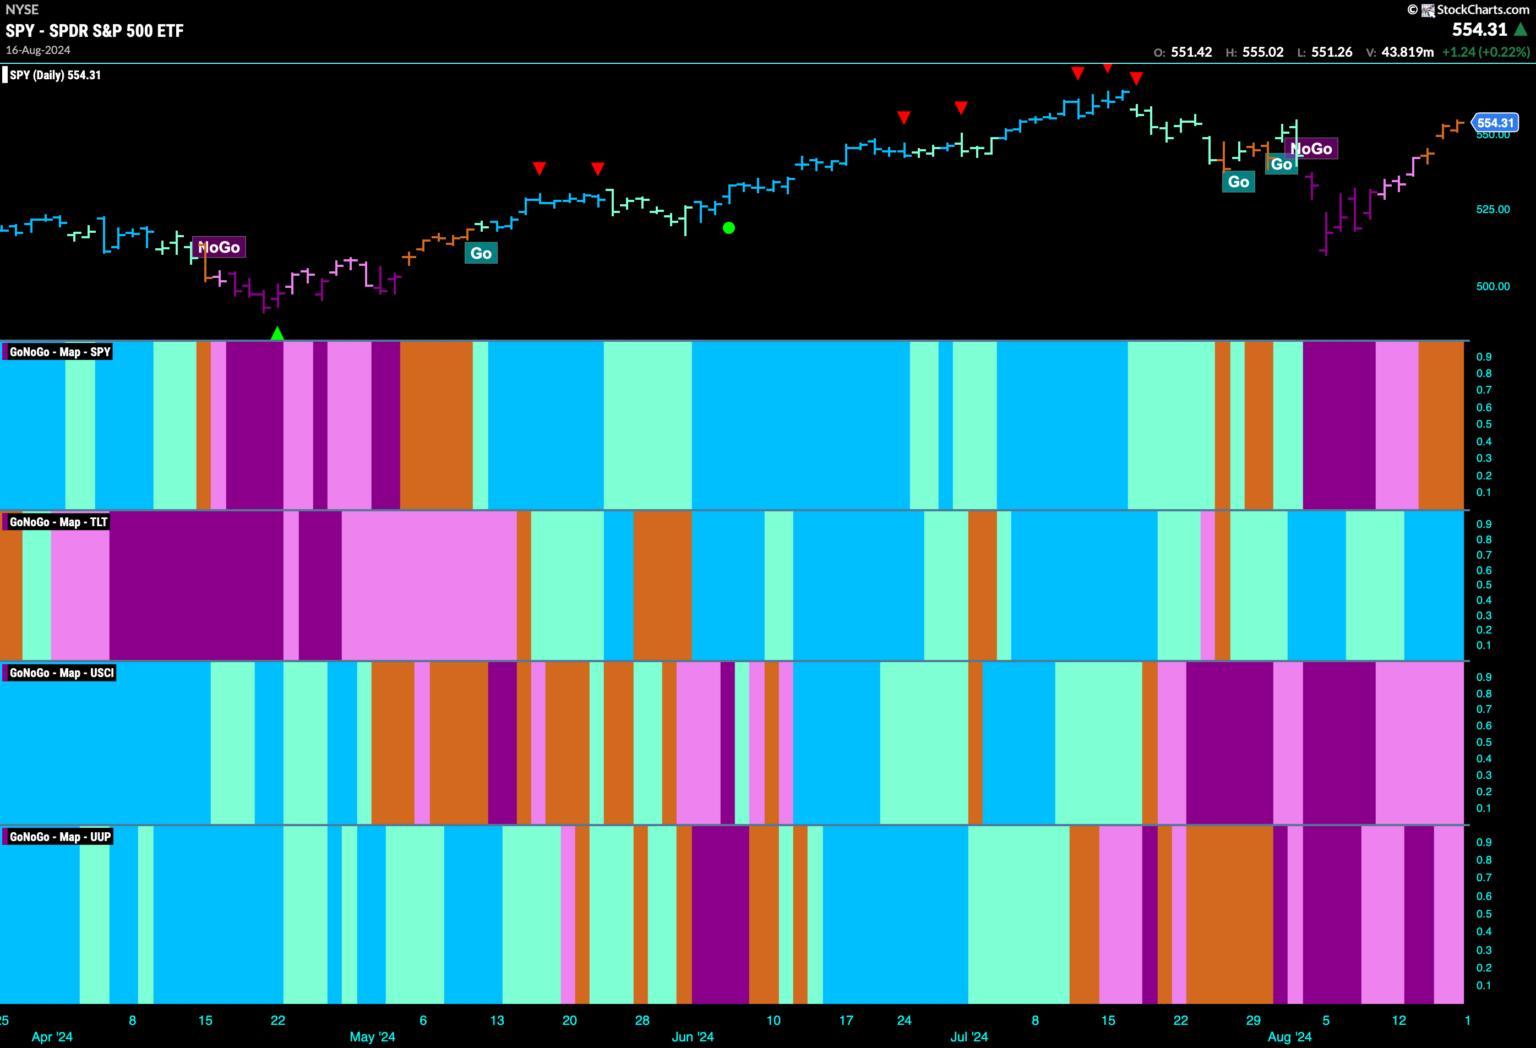
Strong Week for Equities as Defense Holds its Long Term "Go" Trend
Good morning and welcome to this week's Flight Path. Equities continue their path out of the "NoGo" correction. This week we saw amber "Go Fish" bars over the second half of the week. GoNoGo Trend shows that the trend in treasury bond prices saw strength with strong blue bars. U Read More
Members Only
Larry Williams Focus On Stocks8mo ago
Larry's LIVE "Family Gathering" Webinar Airs NEXT WEEK - Thursday, August 22 at 2 PM EDT!
DecisionPoint8mo ago
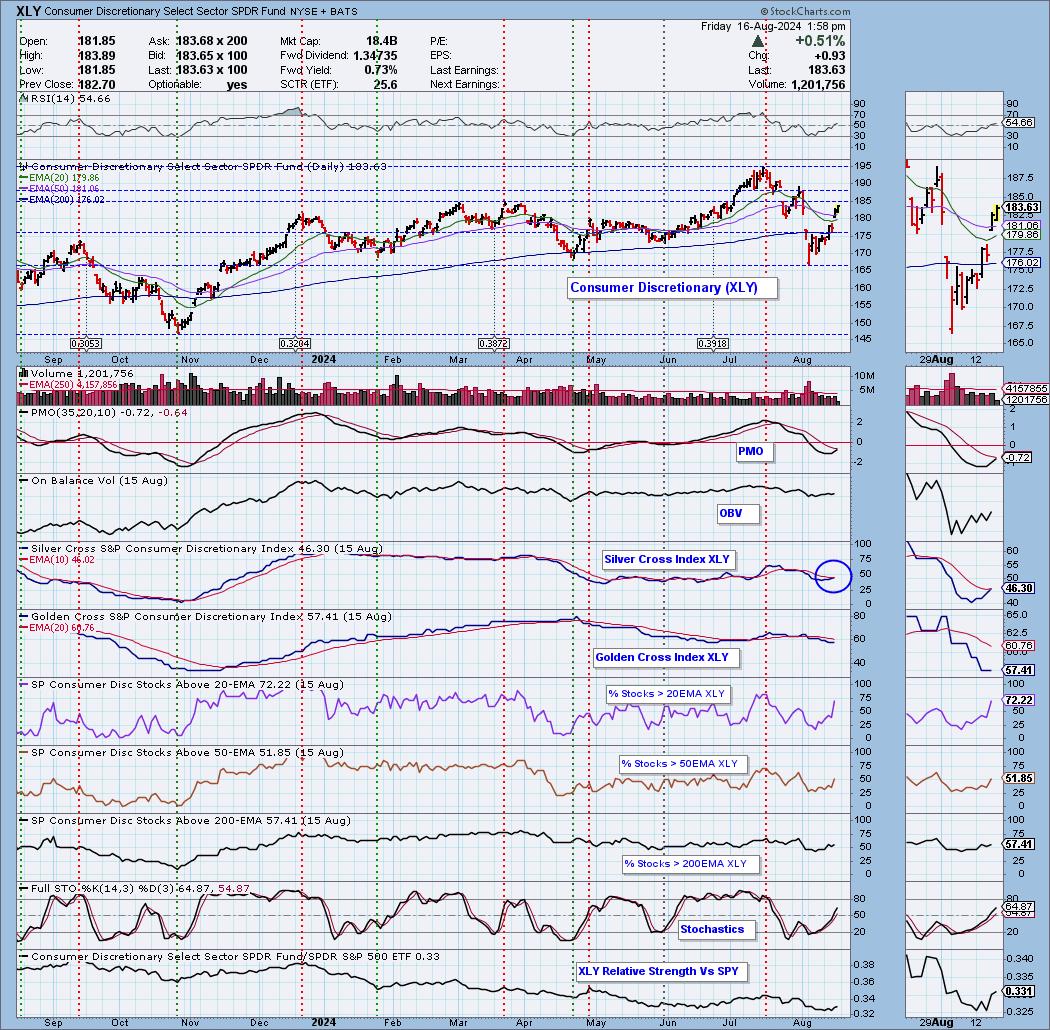
Consumer Discretionary New IT BULLISH Bias
The Silver Cross Index measures the number of stocks that have a 20-day EMA above the 50-day EMA, or are on a "Silver Cross" IT Trend Model BUY Signal. This gives us a more complete picture than simply measuring the number of stocks above their key moving averages Read More
ChartWatchers8mo ago

Will XRT (Retail) Sink or Soar? Here's What the Charts Say
Wall Street rallied Thursday morning as July retail sales jumped 1%—triple what experts expected. Meanwhile, jobless claims dropped, and investors are still riding high on those cooler-than-expected inflation reports (CPI and PPI) Read More
Don't Ignore This Chart!8mo ago

The SCTR Report: Dell Is Gaining Strength. Here's Why the Stock Is a Strong Buy
When the general market is recovering from a pullback, there can be great opportunities to buy on the dip. But how do you identify which stocks to buy? In making this critical judgment, the StockCharts Technical Rank (SCTR) can be an essential tool Read More
The Final Bar8mo ago

What Inflation Fear? Strong Retail Sales Fuel Growth
In this edition of StockCharts TV's The Final Bar, Dave recaps another strong up day for growth leadership names, with ULTA and NVDA powering higher after retail sales numbers pushed aside inflation fears Read More
RRG Charts8mo ago
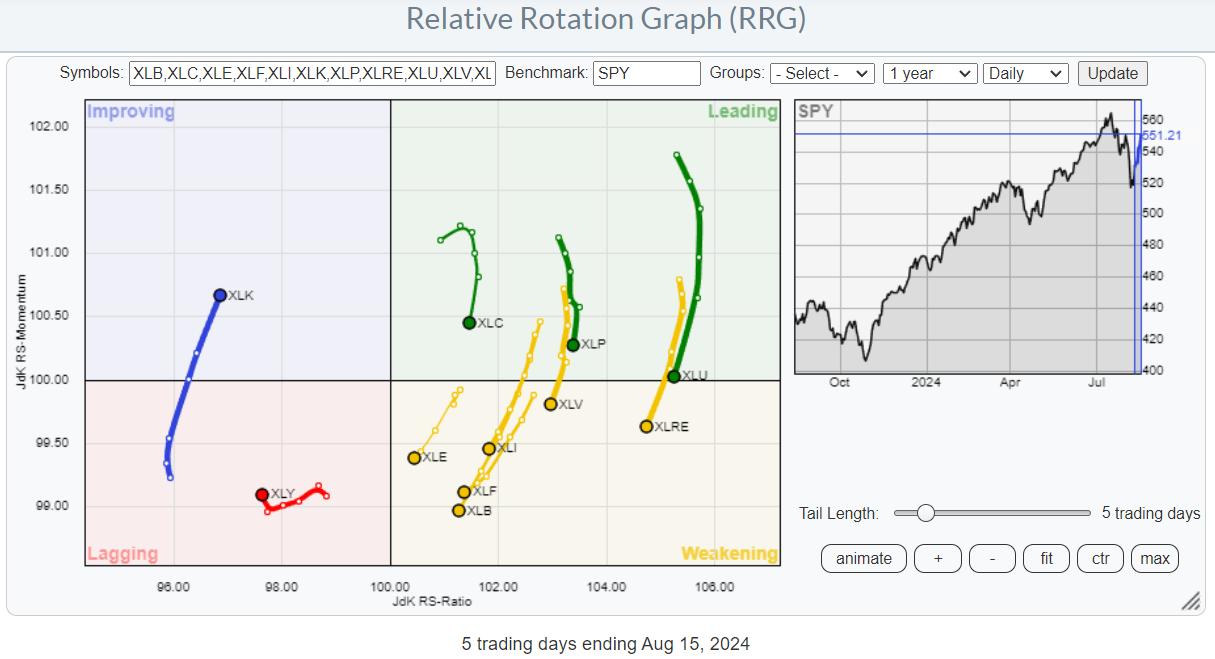
Strength Off the Lows, But Concerns Remain
Stronger than Expected The recent rally out of the August 5th low is definitely stronger than I had anticipated. I was watching the resistance zone between 5350 and 5400, but that area was passed as if there was no supply whatsoever, at least at the index level Read More
ChartWatchers8mo ago

Mag 7 Stocks in the Spotlight as Stock Market Recovers
Cooling July inflation data may have been what the doctor ordered to perk up investor sentiment; the recession fears at the top of investors' minds early last week are a distant memory, or maybe even erased from their memory Read More
The Final Bar8mo ago
Head and Shoulders Top for Semiconductors?
In this edition of StockCharts TV's The Final Bar, Dave shows how breadth conditions have evolved so far in August, highlights the renewed strength in the financial sector with a focus on insurance stocks, and describes how the action so far in Q3 could be forming a potential hea Read More
Stock Talk with Joe Rabil8mo ago

How ADX Stage Analysis Can Make You a BETTER Trader!
In this exclusive StockCharts TV video, Joe shows the four stages a stock or market can be in at any time. He explains each stage and how ADX & Volatility can help define each stage. He then shows what stage the SPY is right and why the bias is still positive Read More
The Final Bar8mo ago

The Growth Trade is Back!
In this edition of StockCharts TV's The Final Bar, Dave recaps an epic rally in mega cap growth stocks, with NVDA up over 6% and META threatening a new 52-week high Read More
Don't Ignore This Chart!8mo ago

SBUX Stock Price Skyrockets: Is Now the Time to Buy?
If you checked the StockChartsTechnical Rank (SCTR) report on Tuesday morning, you might have seen the massive spike in Starbucks' (SBUX) change in value of +62.3. It occupied the highest "Top Up" spot for the Large-Cap stocks category Read More
RRG Charts8mo ago

CRITICAL Week Ahead for S&P 500
In this video from StockCharts TV, Julius assesses various rotations using Relative Rotation Graphs, starting at asset class level and then moving to sectors Read More
Members Only
Martin Pring's Market Roundup8mo ago
VIX Indicates Fear, But Is It Enough?
Last Monday, markets around the world experienced a sharp drop as the unwinding of yen carry trades followed the previous Friday's response to a weak employment report Read More
The Final Bar8mo ago

Why Bonds and Gold Are Outperforming Stocks
In this edition of StockCharts TV's The Final Bar, Dave recaps a choppy Monday for the equity markets, as gold tests new all-time highs and interest rates continue to plummet Read More
DecisionPoint8mo ago

DP Trading Room: Mortgage Rates are Falling - Watch Real Estate
Mortgage Rates fell quite a bit this past week and no one is really talking about it. One area that we will want to watch closely as rates fall is Real Estate (XLRE). This sector has already been moving in the right direction. It now has an opportunity to rally further Read More
The MEM Edge8mo ago

CAUTION ADVISED Ahead of This Week's Inflation Data!
In this StockCharts TV video, Mary Ellen dives into her broad market analysis, sharing what she needs to see before it's safe to get back in. She also shares her top candidates for once the markets turn positive, including META, LLY and NFLX Read More
GoNoGo Charts8mo ago

Financials Power Price Rally off Lows
Good morning and welcome to this week's Flight Path. Equities remained in a "NoGo" trend this past week however after gapping lower on Monday, prices rallied until on Friday GoNoGo Trend painted a weaker pink bar Read More
Analyzing India8mo ago

Week Ahead: NIFTY Stays Tentative As Defensive Setup Develops; Know These Levels Well
The market extended its corrective move in the previous week; over the past five sessions, it has remained quite choppy and totally devoid of any definite directional bias. It absorbed a few global jerks and saw gaps on either side of its previous close on different occasions Read More
GoNoGo Charts8mo ago
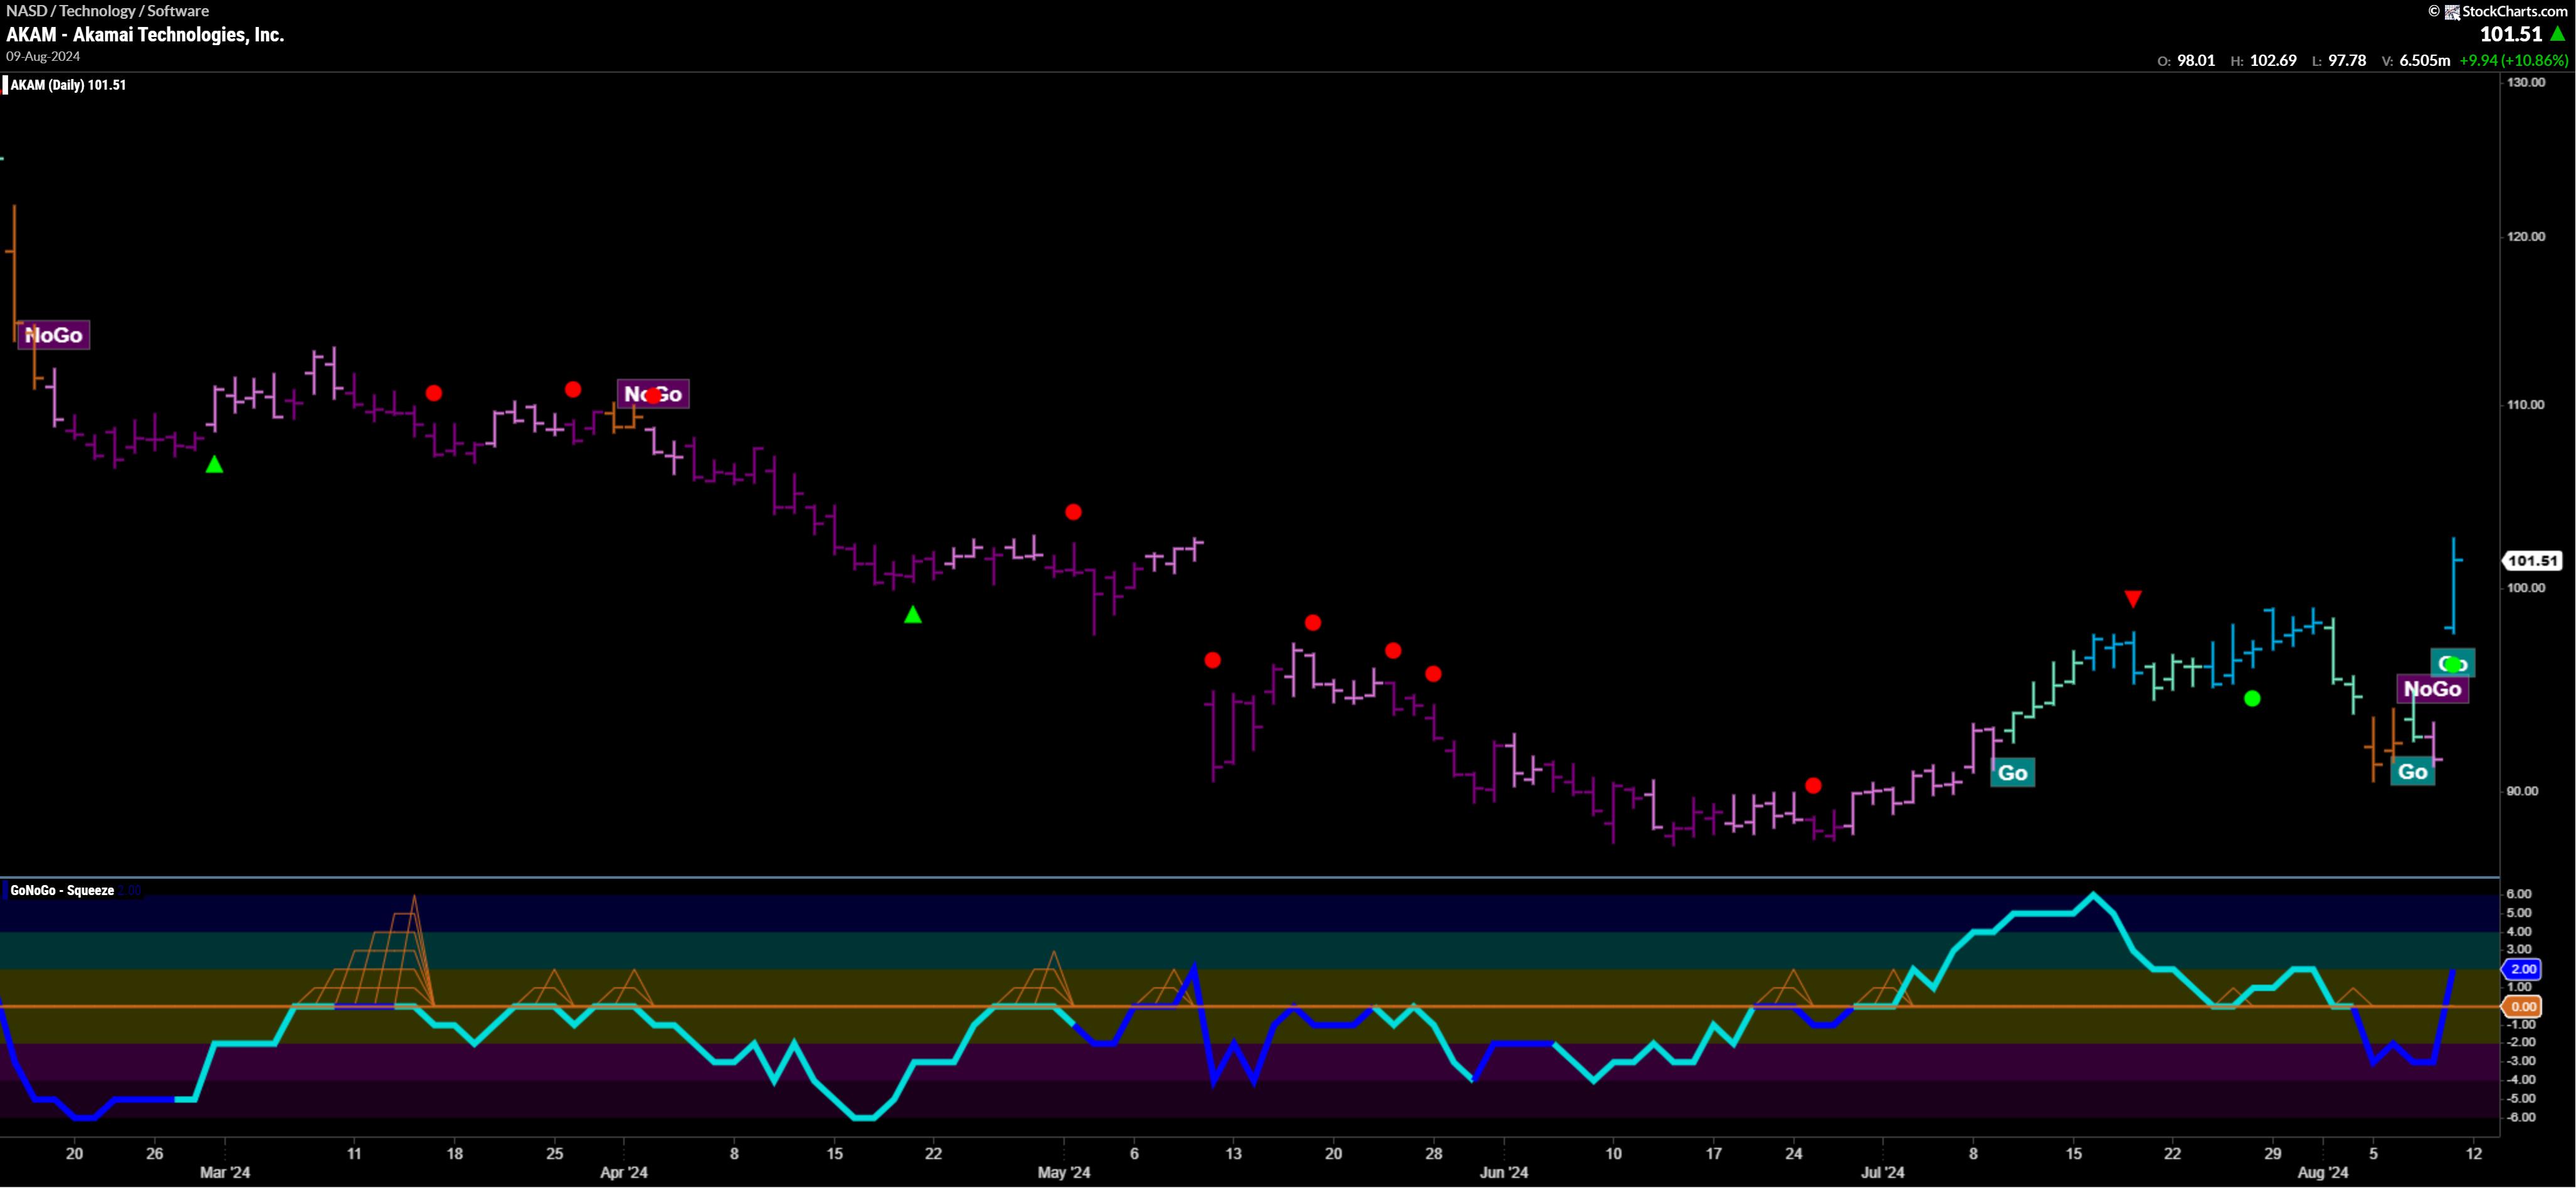
Top 5 Stocks in "Go" Trends | Fri Aug 9, 2024
Top 5 Stocks in "Go" Trends Trend Continuation on Rising Momentum GoNoGo Charts® highlight low-risk opportunities for trend participation with intuitive icons directly in the price action Read More
The Mindful Investor8mo ago

Three Market Sentiment Indicators Confirm Bearish Phase
While the S&P 500 and Nasdaq experienced a decent upside bounce this week, they still remain down 3.2% and 4.4% respectively for the month of August Read More
ChartWatchers8mo ago

S&P 500 Teetering On 100-Day Moving Average Support
A sigh of relief? The US stock market started the week on a pessimistic note, but changed course toward the end of the week, ending in a more positive tone Read More
The Final Bar8mo ago

How the PROS Time Entry Points
In this edition of StockCharts TV's The Final Bar, Dave presents a special all-mailbag episode, answering viewer questions on optimizing entry points for long ideas, best practices for point & figure charts, and the relationship between gold and interest rates Read More
Art's Charts8mo ago
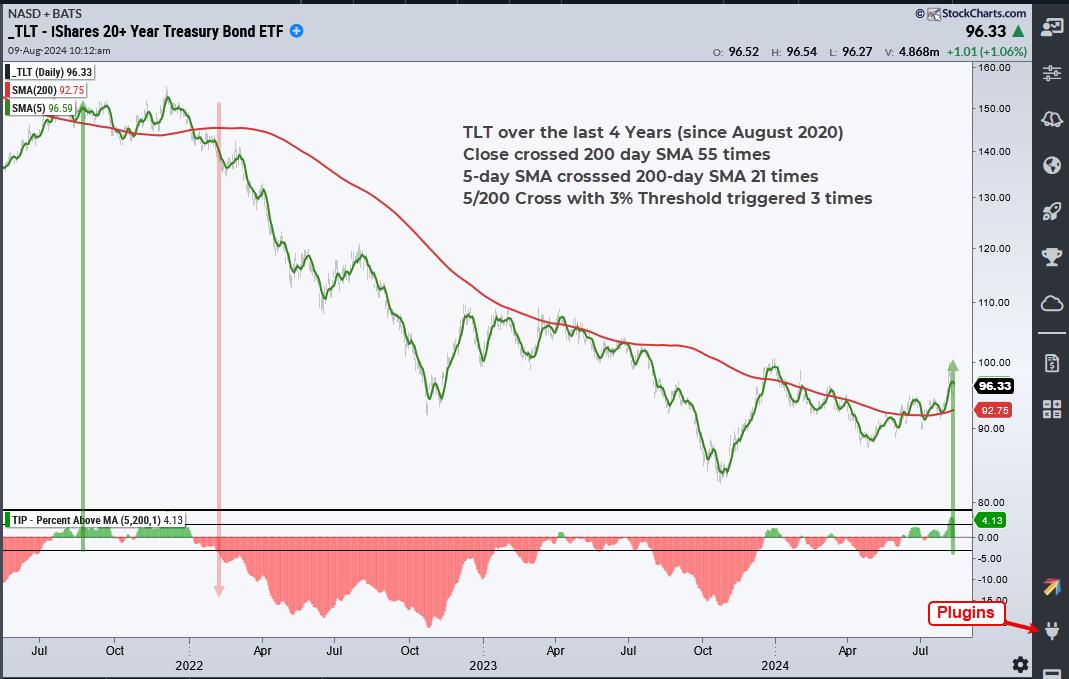
TLT Turns the Corner and Starts to Lead
The 20+ Yr Treasury Bond ETF (TLT) is turning the corner as a long-term trend indicator turns bullish and price extends on a breakout. TLT is also starting to outperform the S&P 500 EW ETF (RSP), for the first time in a long time Read More
DecisionPoint8mo ago

Substantial Deterioration in Number of IT BUY Signals
DecisionPoint tracks 26 market, sector, and industry group indexes, and we monitor moving average crossovers for those indexes to assess the bullish or bearish condition of those indexes Read More
Don't Ignore This Chart!8mo ago

Will USO Soar to $83? Here Are the Key Levels to Watch!
Oil prices are climbing after the EIA reported a surprise inventory crunch. Adding fuel to the fire? Tensions in the Middle East. WTI Crude has been trading in choppy motion since March 2023 Read More
Members Only
Martin Pring's Market Roundup8mo ago
The Great Rotation: Not What You Think
Just so we are on the same page, I looked up "Great Rotation" on Microsoft's Copilot and came away with this definition: a rotation out of big U.S. growth stocks (think "The Magnificent Seven") and into small, cheap, and international stocks Read More
Don't Ignore This Chart!8mo ago

QQQ: Critical Levels to Watch as Nasdaq Teeters on the Edge
Just Another Manic Monday? On Monday, the Nasdaq plunged over 3%. With the S&P 500 dropping a similar amount and the Dow plummeting over 1,000 points (a 2.6% drop), it was the biggest one-day drop since September 2022 Read More
Trading Places with Tom Bowley8mo ago

Not Much Good Takes Place When This Happens
As a long-term stock trader, one development in the stock market takes me and many others to our collective knees. It's a Volatility Index ($VIX) that rises past 20. There has never been a bear market that's unfolded with a VIX that remains below 20 Read More
ChartWatchers8mo ago

The SCTR Report: Carvana Stock Makes It To Top of the Podium Today
On a day when the S&P 500 ($SPX) drops over 200 points at the open, and the Dow Jones Industrial Average ($INDU) and Nasdaq Composite ($COMPQ) drop more than 1,000 points, looking at your portfolio value can be discouraging. But it shouldn't be Read More
GoNoGo Charts8mo ago

Stocks Get Defensive as Market Index Enters "NoGo"
Good morning and welcome to this week's Flight Path. Equities could not hold onto "Go" colors any longer and we saw a strong purple "NoGo" bar as the trend changed on the last bar of the week Read More
DecisionPoint8mo ago

DP Trading Room: Bear Market Rules Apply
The market is dropping perilously right now and so it is time to review Bear Market Rules. Today Erin and Carl share their rules for trading during a bear market move. We aren't officially in a bear market and we may not get there, but there is likely more downside to absorb Read More
Wyckoff Power Charting8mo ago

Who Let the DOG Out?
In the classroom we would have students alter their view of charts they were evaluating to gain fresh perspective and possibly enhance their analysis. Students often had Ah-Ha moments after freshening their interpretation of a chart they had previously laid eyes on many times Read More
Analyzing India8mo ago

Week Ahead: NIFTY Stays Prone To Profit-Taking Bouts; Guard Profits and Stay Stock-Specific
The previous week turned out quite volatile for the markets as they not only marked a fresh lifetime high but also faced corrective pressure as well towards the end of the week. The markets maintained an upward momentum all through the week Read More
ChartWatchers8mo ago

Recession Fears Top of Mind As Tech Stocks Selloff
The dog days of summer are here. And the stock market gives us a brutal reminder of this. The first trading day of August began on a very pessimistic note. Thursday's weak manufacturing data spooked the stock market Read More
RRG Charts8mo ago

It's Been a Long Time Mr Bear, Where Have You Been?
And then .. all of a sudden.. things are heating up. Lots of (downside) market action in the past week. Let's see what sector rotation and RRGs can tell us. The RRG at the top is a daily RRG, as recent price action has significantly impacted near-term rotations Read More
Art's Charts8mo ago

This Breadth Indicator Points to More Downside and a Potential Opportunity
The broad market and the group are big drivers for stock performance. Recently, the Nasdaq 100 ETF (QQQ) led the market lower with sizable declines over the last five weeks Read More


