Archived News
Don't Ignore This Chart!6mo ago

Dell's Bullish Climb: Should You Get In Now?
When the market is rallying in full swing, it can sometimes be difficult to select which stocks, among the hundreds, might present the best case to buy. For spotting the strongest stocks on a technical basis, the StockCharts Technical Rank (SCTR) can be an essential tool Read More
DecisionPoint6mo ago
Signal Scoreboard As Good As It Gets
At DecisionPoint, we track intermediate-term and long-term BUY/SELL signals on twenty-six market, sector, and industry group indexes Read More
ChartWatchers6mo ago

United Airlines Stock Soars: Watch For a Promising Buying Opportunity
Airline stocks had a strong day, with United Airlines (UAL), American Airlines (AAL), and Delta Airlines (DAL) posting strong gains Read More
Stock Talk with Joe Rabil6mo ago

Why the MACD Crossover Signal is SO Important
In this exclusive StockCharts TV video, Joe shares the MACD downside crossover signal and explains the different ways it can play out when it takes place above the MACD zero line Read More
RRG Charts6mo ago

Sector Rotation is Giving Conflicting Stories!
In this video from StockCharts TV, Julius dives in to the sector rotation model, trying to find any alignment between theoretical and real-life rotations of sectors in combination with the economic cycle Read More
The Mindful Investor6mo ago

The Master Sentiment Chart You Need to Follow
At some point, this raging and relentless bull market has to slow down -- right?!? And yet, as you'll see from a quick review of three key market sentiment indicators, there could still be plenty of room for further upside in risk assets Read More
Members Only
Larry Williams Focus On Stocks6mo ago
Larry's Final LIVE "Family Gathering" Webinar Airs THIS WEEK - Friday, October 18 at 2 PM EDT!
ChartWatchers6mo ago

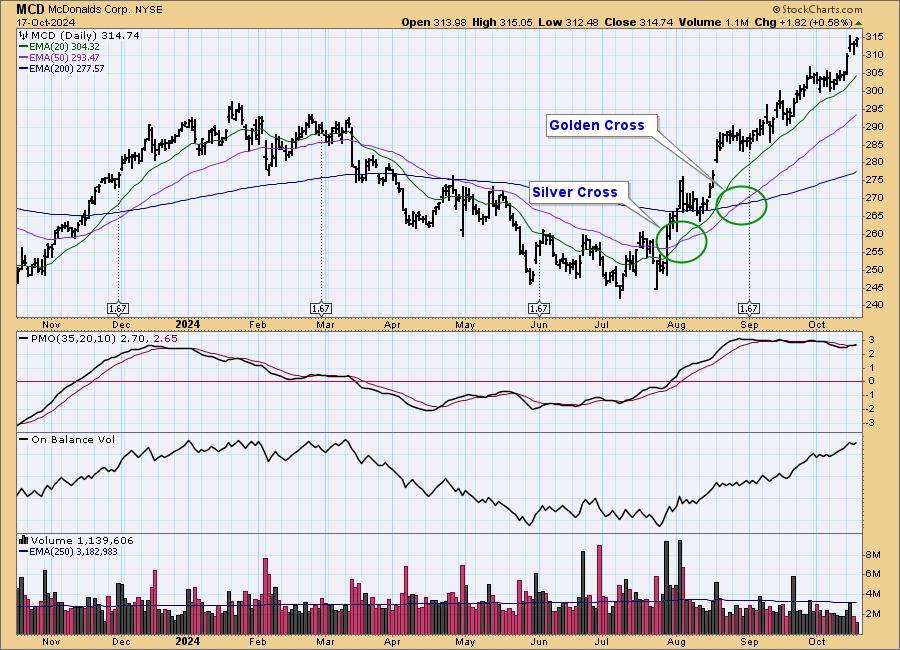
SCTR Report: American Tower is Breaking Out Now; Don't Miss It!
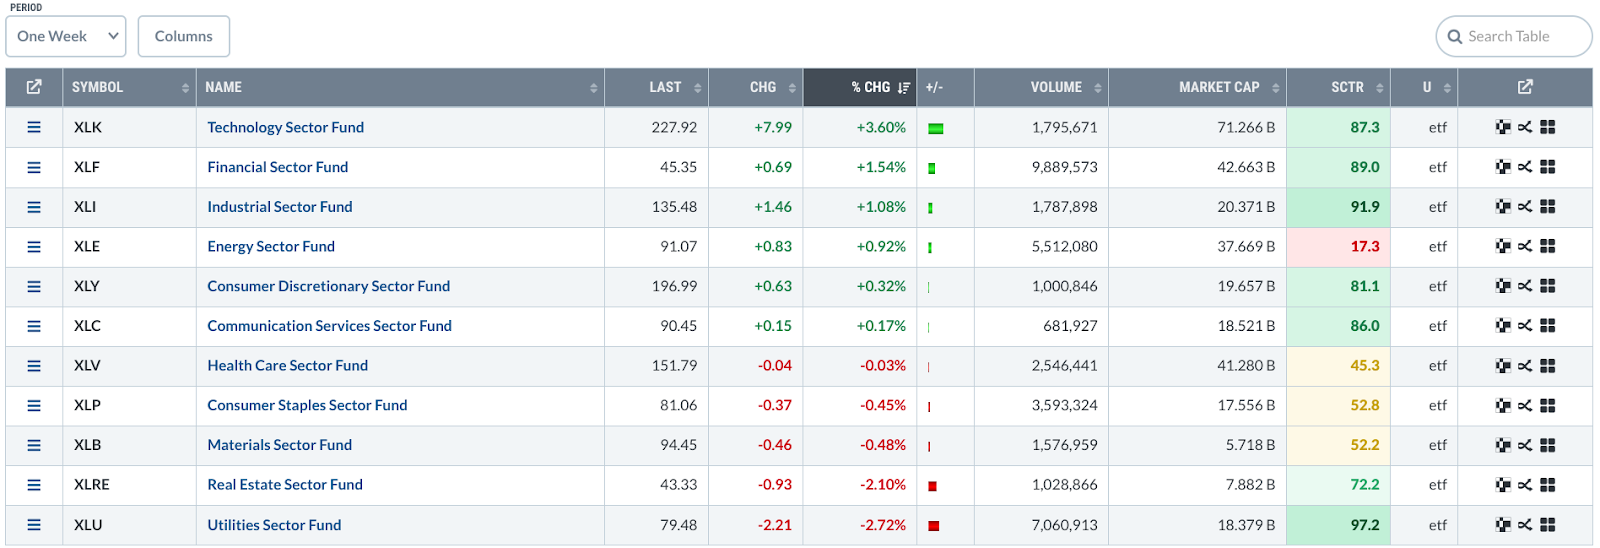
Semiconductors sold off on Tuesday, crushing the Technology sector. But the Real Estate sector didn't suffer a similar fate; in fact, it was the top sector performer for the day Read More
Members Only
Martin Pring's Market Roundup6mo ago
The Next Big Move in Yields May Be Different Than You Think
Below, Chart 1 shows a weekly plot for the 30-year yield, where we can see a perfectly formed top whose completion was followed by a negative 65-week EMA crossover. At the time of the breakdown, there were few grounds for suspecting a false break Read More
The Mindful Investor6mo ago
Stay Ahead: Key Sentiment Indicators to Track in October 2024!
Which market sentiment indicators should we follow to validate the current bull market phase and anticipate a potential market top? David Keller, CMT breaks down three sentiment indicators he's watching in October 2024, explains their calculations and methodology, reviews their s Read More
Don't Ignore This Chart!6mo ago

MarketCarpets: The Fastest Way to Scan for Hidden Market Opportunities
When Wall Street rings its opening bell, there are two things you need to do to start your day: Get the big picture on what's happening in the markets. Spot the market opportunities, especially the ones that aren't apparent. There are plenty of ways to get your market updates Read More
DecisionPoint6mo ago
DP Trading Room: NVDA Lifts Semiconductors Higher
It's time to put Semiconductors in the spotlight. NVDA is starting to trade at all-time highs again and that is likely to bring the Semiconductor industry group up to its own all-time highs. Erin discusses Semiconductors "under the hood" and highlights the NVDA chart Read More
GoNoGo Charts6mo ago
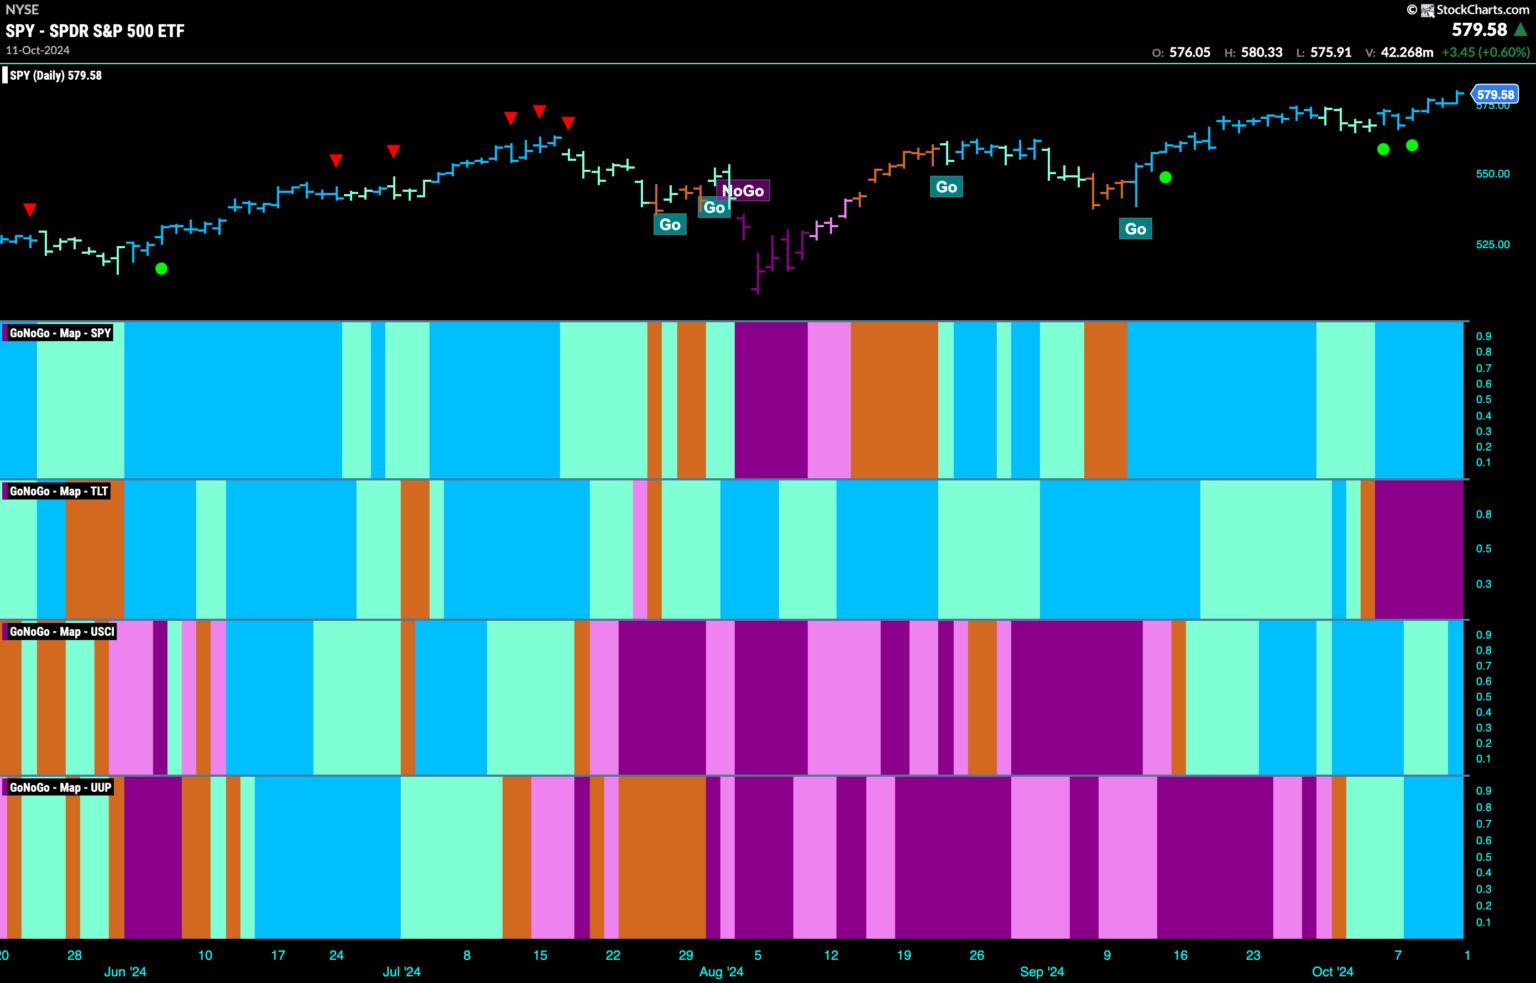
Equities Stay Strong as Technology Returns to Out-Performance
Good morning and welcome to this week's Flight Path. Equities saw the "Go" trend not just survive but stay strong this week as the indicator painted a week of uninterrupted bright blue bars Read More
Analyzing India6mo ago
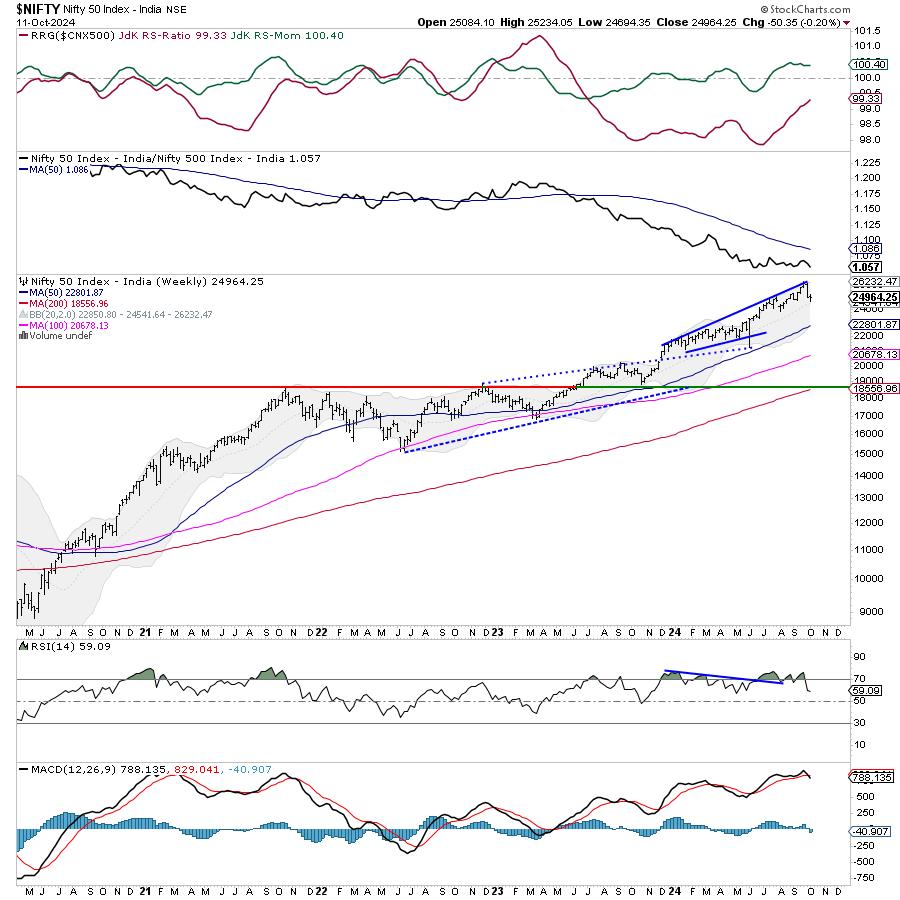
Week Ahead: While Nifty Consolidates, Keeping Above These Levels Crucial
The week that went by was in complete contrast to the week before, as the markets heavily consolidated in a tight range Read More
Art's Charts6mo ago
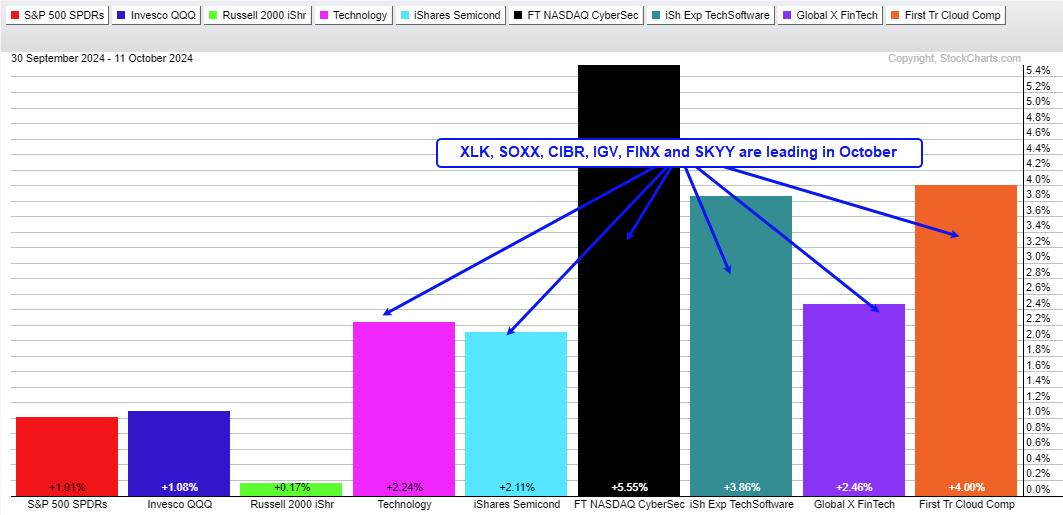
Cybersecurity ETF Comes to Life with New Trending Phase
The Cybersecurity ETF (CIBR) is resuming the lead as it surged to new highs this past week. It is important to note that CIBR began its leadership role a lot earlier because it hit a new high in late August Read More
The Mindful Investor6mo ago

The One Volume Indicator You Should Follow
I was asked recently about volume, specifically why I don't feature volume often on my daily market recap show, CHART THIS with David Keller, CMT Read More
The MEM Edge6mo ago

Last Week's Pullback is a Buying Opportunity!
In this StockCharts TV video, Mary Ellen highlights what's driving these markets higher despite a rise in interest rates. She also focuses on the leadership area in Technology and shares several stocks from this group Read More
DecisionPoint6mo ago

Small-Caps Get on Board!
Yesterday, we posted a short video about the lack of participation within the mid-and small-cap universes. Here, we had a rally to new all-time highs, yet we weren't seeing much of anything out of the broad market Read More
RRG Charts6mo ago
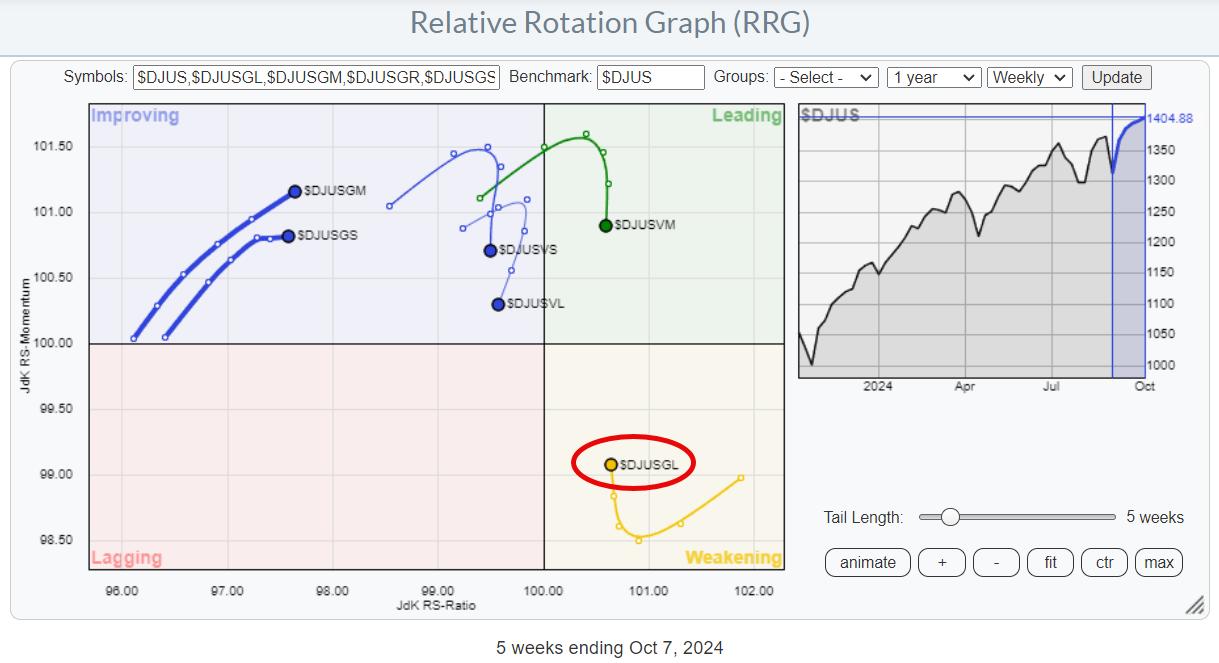
It's Large-Cap Growth Stocks (Mag 7) Once Again
Where is the Recent Performance in the S&P 500 Coming From? Let's start with the relative rotation graph (RRG) for growth and value sectors, dissected by size to get a clearer picture. The first RRG reveals a standout performer: the large-cap growth group Read More
DecisionPoint6mo ago
Alert: Small-Caps Not Participating in New All-Time Highs
DecisionPoint has started posting short video alerts on our YouTube Channel. These videos are less than four minutes and give you the scoop on news you need to know about the market right now. Subscribe to the DecisionPoint Read More
Don't Ignore This Chart!6mo ago
Tech vs Semiconductors: Which One Should You Be Trading?
As an investor and a technical analyst, there are numerous tools available for you on StockCharts that you can use to find tradable opportunities. One idea is to begin with a survey of top-performing sectors Read More
Stock Talk with Joe Rabil6mo ago

What's Wrong With This SPX Breakout?
In this exclusive StockCharts TV video, Joe presents the price pattern to follow the recent breakout in the S&P 500. He discusses narrow range bars, wide range bars and when they are important Read More
The Mindful Investor6mo ago

Three Thoughts on Risk Management for October 2024
Even though the S&P 500 index appears to be relentlessly pursuing new all-time highs, the traditional seasonal weakness in October leads me to be very focused on risk management right about now Read More
ChartWatchers6mo ago

SCTR Report: Carvana Stock Skyrockets, Hits a New 52-Week High -- What This Means for Investors
Apologies for revisiting Carvana (CVNA), but it has such a beautiful chart pattern playing out the way it should. After bottoming out in a cup with handle pattern on the weekly chart and breaking out of the handle, Carvana stock has been in an upward-moving trend Read More
RRG Charts6mo ago

Why This S&P Support Level is SO IMPORTANT
In this video from StockCharts TV, Julius presents a few conflicting rotations and signals that continue to warrant caution while the S&P 500 keeps hovering just above support. With the negative divergences between price and MACD/RSI remaining intact, SPY should not break 565 Read More
Don't Ignore This Chart!6mo ago

Oil Prices Soar Amid Middle East Tensions – What's Next for Gas Prices?
Monday saw something of a bloodbath on Wall Street, with the Dow ($INDU) plunging over 500 points at its worst and the S&P 500 ($SPX) and Nasdaq ($COMPQ) falling over 1%. Higher oil prices, triggered by tensions in the Middle East, played a big hand in Monday's market mayhem Read More
The Final Bar6mo ago

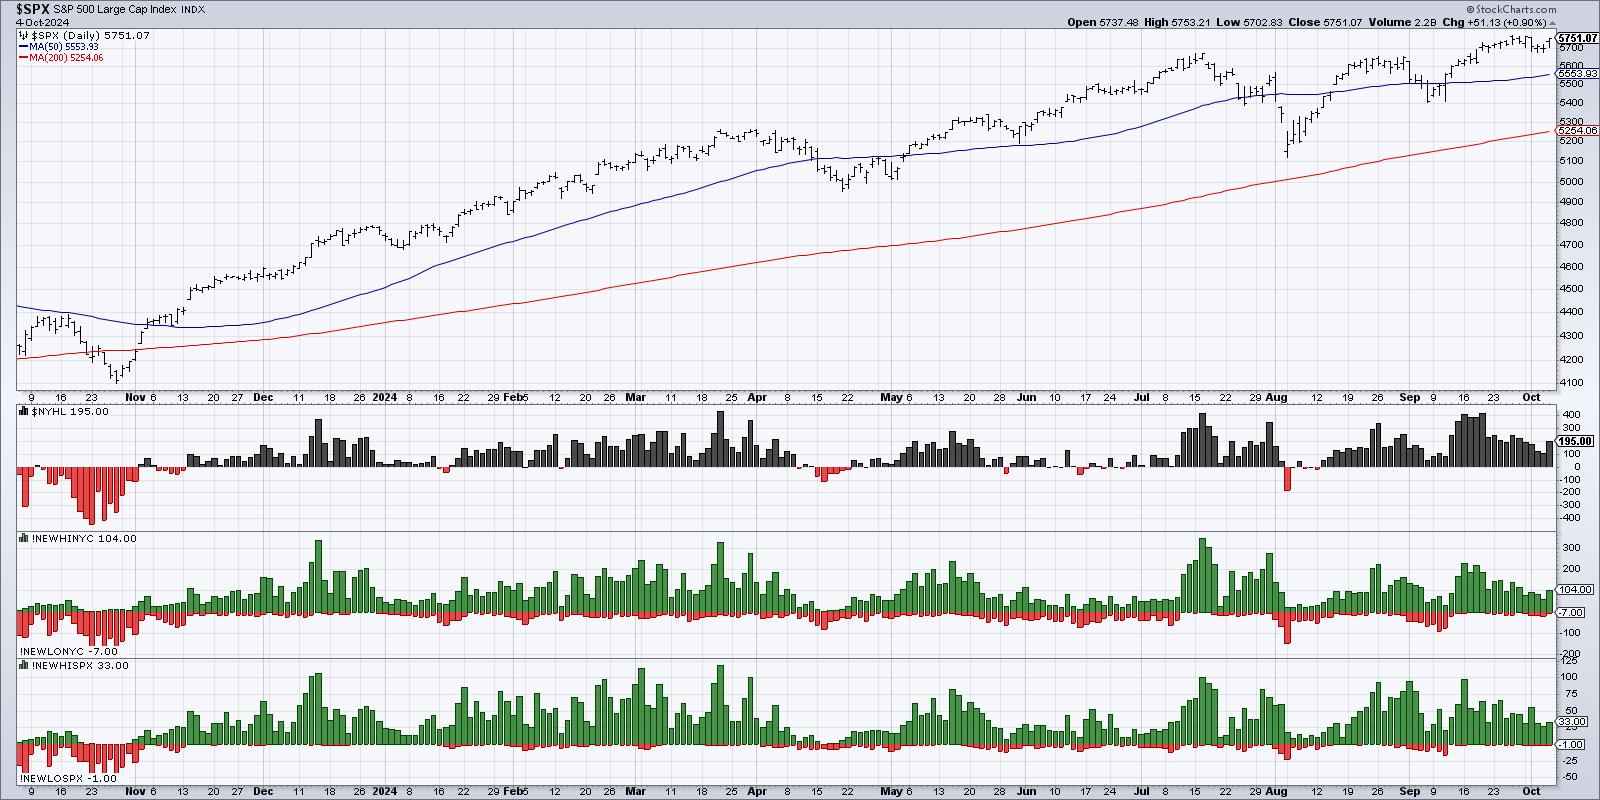
Market Top in October? 2007 vs. 2024
Will we see a major market top during the month of October? Dave breaks down three market breadth indicators and compares their current configuration to what we observed at the 2007 market top Read More
Members Only
Martin Pring's Market Roundup6mo ago
Did We Just See a False Breakdown in Crude Oil?
Using West Texas Crude, Chart 1 features one of my favorite techniques for identifying changes in long-term trends, which is simply a PPO using the 6- and 15-month parameters. When it is above zero, it's bullish, and when below, bearish Read More
GoNoGo Charts6mo ago

Equities Remain in "Go" Trend and Lean into Energy
Good morning and welcome to this week's Flight Path. Equities saw the trend remain and as the week came to a close we saw more strong blue "Go" bars as price rallied close to prior highs Read More
DecisionPoint6mo ago

DP Trading Room: A Case for a Market Top
During today's market analysis Carl laid out his reasons why we believe we are at a market top. He discusses the current market price action combined with exclusive DecisionPoint indicators to substantiate his position. Don't miss his analysis Read More
Analyzing India6mo ago

Week Ahead: Putting Market Moves in Perspective; Watch Nifty From This Angle
On the back of one of the major FII selloffs seen in recent times, the markets succumbed to strong corrective pressure through the week and ended on a very weak note Read More
The MEM Edge6mo ago
Stealth AI Stocks Are Taking Off in a Flat Market
In this StockCharts TV video, Mary Ellen highlights the continuation rally in AI-related stocks while also reviewing broader market conditions. The move higher in yields as well as volatility were discussed heading into next week's FOMC notes and inflation data Read More
ChartWatchers6mo ago

Stocks Soar, Energy Prices Spike: Are Geopolitical Tensions to Blame?
After Friday's stellar jobs report—254,000 jobs added in September vs. the Dow Jones forecast of 15,000—stocks and Treasury yields initially reacted with a big jump. The data confirms the strength of the labor market and the US economy Read More
The Mindful Investor6mo ago
Does the Market Have Bad Breadth?
As a bull market reaches an exhaustion point, market breadth indicators often tend to diverge from the price action of the benchmarks. This "breadth divergence" occurs as leading names begin to falter, and initial selling drives some stocks down to new swing lows Read More
Art's Charts6mo ago
What More do the Bulls Want?
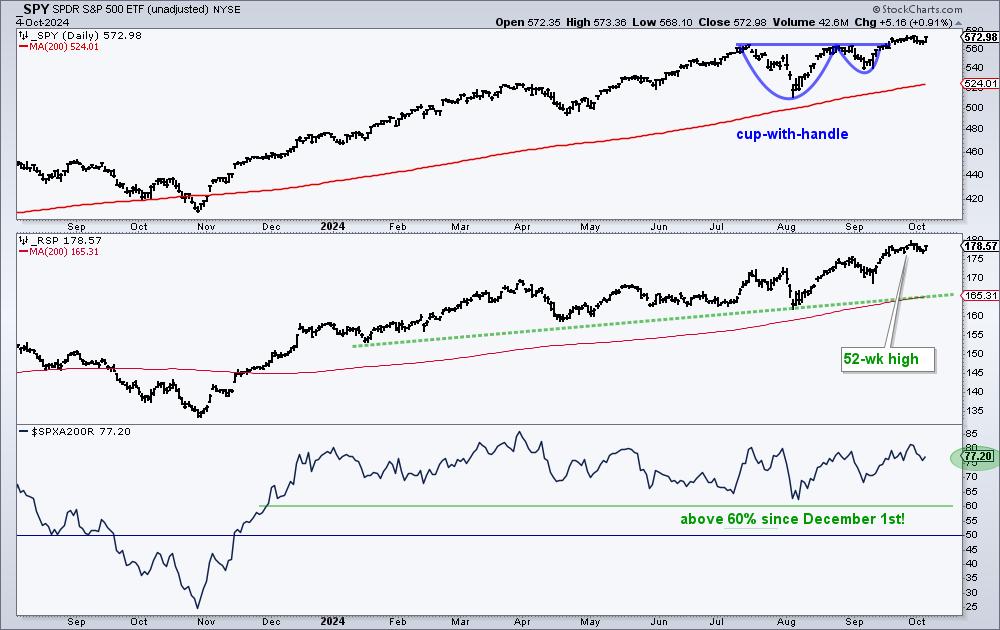
It is a bull market for stocks. On the chart below, the S&P 500 SPDR (SPY) recently broke rim resistance of a cup-with-handle pattern and is trading near a 52-week high Read More
Add-on Subscribers
OptionsPlay with Tony Zhang6mo ago
Coming Soon: A New Era of Options Trading With OptionsPlay
We know that successful options trading requires precise analysis and actionable options strategies. That's why we're excited to introduce a groundbreaking partnership between OptionsPlay and StockCharts Read More
Trading Places with Tom Bowley6mo ago

Jobs Soar Past Estimates, But What Happens Next?
This morning, September nonfarm payrolls soared past expectations, 254,000 vs. 132,500. Adding to the bullishness was the upward revision to August nonfarm payrolls as the prior reading of 142,000 was boosted to 159,000 Read More
RRG Charts6mo ago

Will Technology Drive S&P Higher in October?
In this video from StockCharts TV, Julius explores the October seasonal outlook for the S&P 500 and various sectors Read More
Don't Ignore This Chart!6mo ago

Gold Price Surge: What Goldman Sachs' $2,900 Forecast Means for Investors
Here's the issue with gold: it's difficult to find as much info on it as stocks. For many investors, the buzz around Costco's (COST) gold sales put gold back on the mainstream radar. But that won't tell you if it's still a smart buy or what price you should pay for it Read More
Members Only
Martin Pring's Market Roundup6mo ago
China Stocks May Be On to Something
China's stock market exploded last week in an amazing rally, so formidable that it raises the question of whether it could be the start of a new bull market, or just a short-covering rally which will quickly fizzle out Read More
Popular Articles

This is the Group to Watch for the Next Bull Market Phase and Separating Noise from Reality

An Oversold Bounce is One Thing - A Bullish Breadth Thrust is Another

When in Doubt, Follow the Leadership

Bullish Percent Index Confirms Short-Term Rebound

200-Day Moving Average Confirms Bearish Phase

Stay Ahead of the Stock Market: Key Bond Market Signals Explained with Charts
Get expert technical commentary delivered straight to your inbox! Sign up for our FREE weekly ChartWatchers Newsletter. Learn More
Featured Authors


Public ChartList Leaders


StockCharts Members unlock complete access to the Stocks & Commodities Magazine archives. Read the latest articles or browse past editions.