Archived News
DecisionPoint5mo ago

Price Momentum Oscillator (PMO) Internals Still a Problem
We noticed on Thursday evening how poor the internals were for the SPY, based on Price Momentum Oscillator (PMO) internals. These internals are the percent of stocks with rising PMOs and the percent of stocks with PMO Crossover BUY Signals Read More
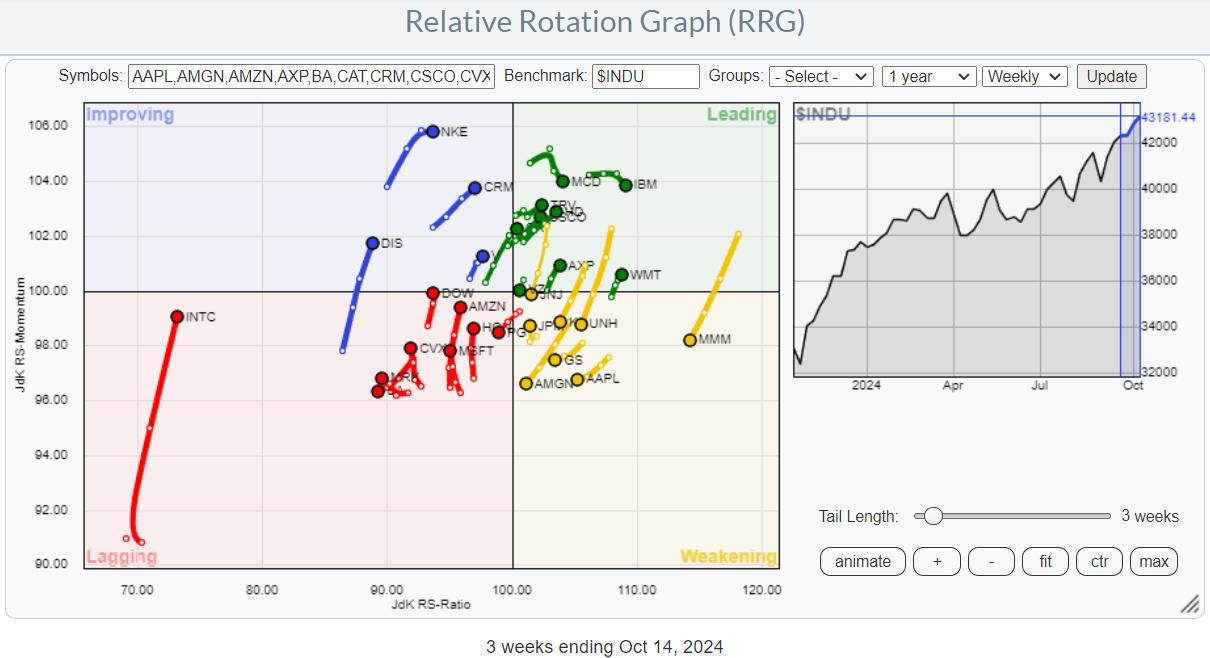
RRG Charts5mo ago

Market Rotation Fueled by Large-Cap Growth (Again)
Following the recent market fluctuations, with a sharp decline and a subsequent rally, it's crucial to examine these movements' underlying factors Read More
ChartWatchers5mo ago

Halloween Scare: The Stock Market Ends October on a Wicked Tone
The Halloween effect caught up with the stock market! October 31 ended up being a spooky day for investors. Tepid earnings from big tech companies and negative news about Super Micro Computer (SMCI) sent stocks plunging, especially semiconductors (more on this below) Read More
The Mindful Investor5mo ago

Will Breadth Divergences Signal the End of the Bull?
As we near the end of October 2024, it's important to note that the market trends remain quite strong. Despite plenty of short-term breakdowns in key stocks this week, our Market Trend Model remains bullish on all time frames Read More
Don't Ignore This Chart!5mo ago

Homebuilding Rebound: How to Catch the Trend Early On
Homebuyers are still on the sidelines, waiting for better mortgage rates, while homebuilders are gearing up for a potentially strong 2025. Despite mortgage rates hitting two-year lows, buyers are holding back, expecting rates and prices to drop further Read More
ChartWatchers5mo ago

The SCTR Report: Learn How to Scan and Identify Winning Stocks
When the stock market hesitates to move in either direction, it becomes challenging to identify potential trading candidates. For this reason, it's a good idea to have a checklist of items to go over during the trading day Read More
Stock Talk with Joe Rabil5mo ago

A Simple Candle With BIG Meaning
In this exclusive StockCharts video, Joe shows a specific candlestick pattern that, when it develops at the right time, can signal the start of a new upleg Read More
Don't Ignore This Chart!5mo ago

Cruise Or Soar? Carnival, Delta, and United Hit New Highs—Which One's Your Best Bet?
One of several effective StockCharts tools you can use to spot potential trading or investing opportunities is to check the New Highs panel in Your Dashboard Read More
Members Only
Martin Pring's Market Roundup5mo ago
Four Sectors That Have Just Experienced Bearish Weekly Action
Most weekends, I flip through a chartlist featuring weekly bars and candles for sectors, country ETFs, currencies, bonds and some commodities. The idea is to see whether any of these entities are showing signs of bullish or bearish reversals Read More
The Mindful Investor5mo ago
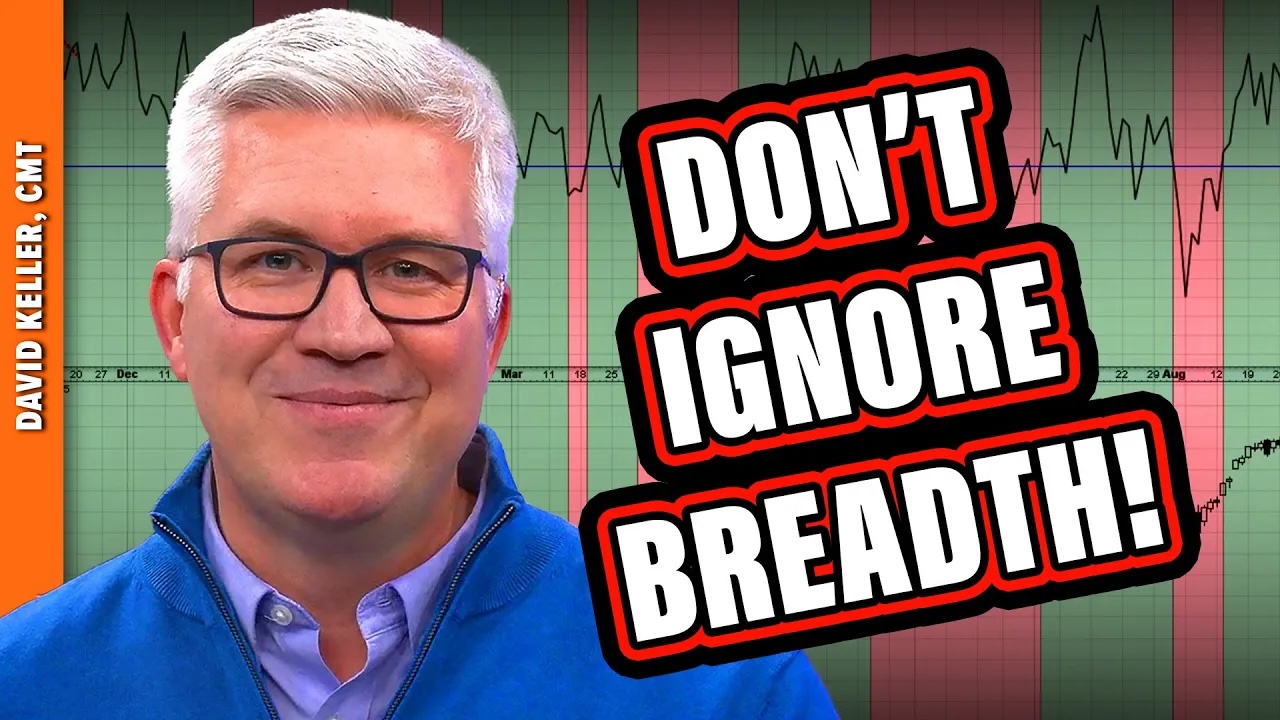
Top 5 Breadth Indicators You Can't Afford to Ignore!
In this video, Dave digs into five market breadth indicators every investor should track as we navigate a volatile period including Q3 earnings, the US elections, and the November Fed meeting Read More
DecisionPoint5mo ago
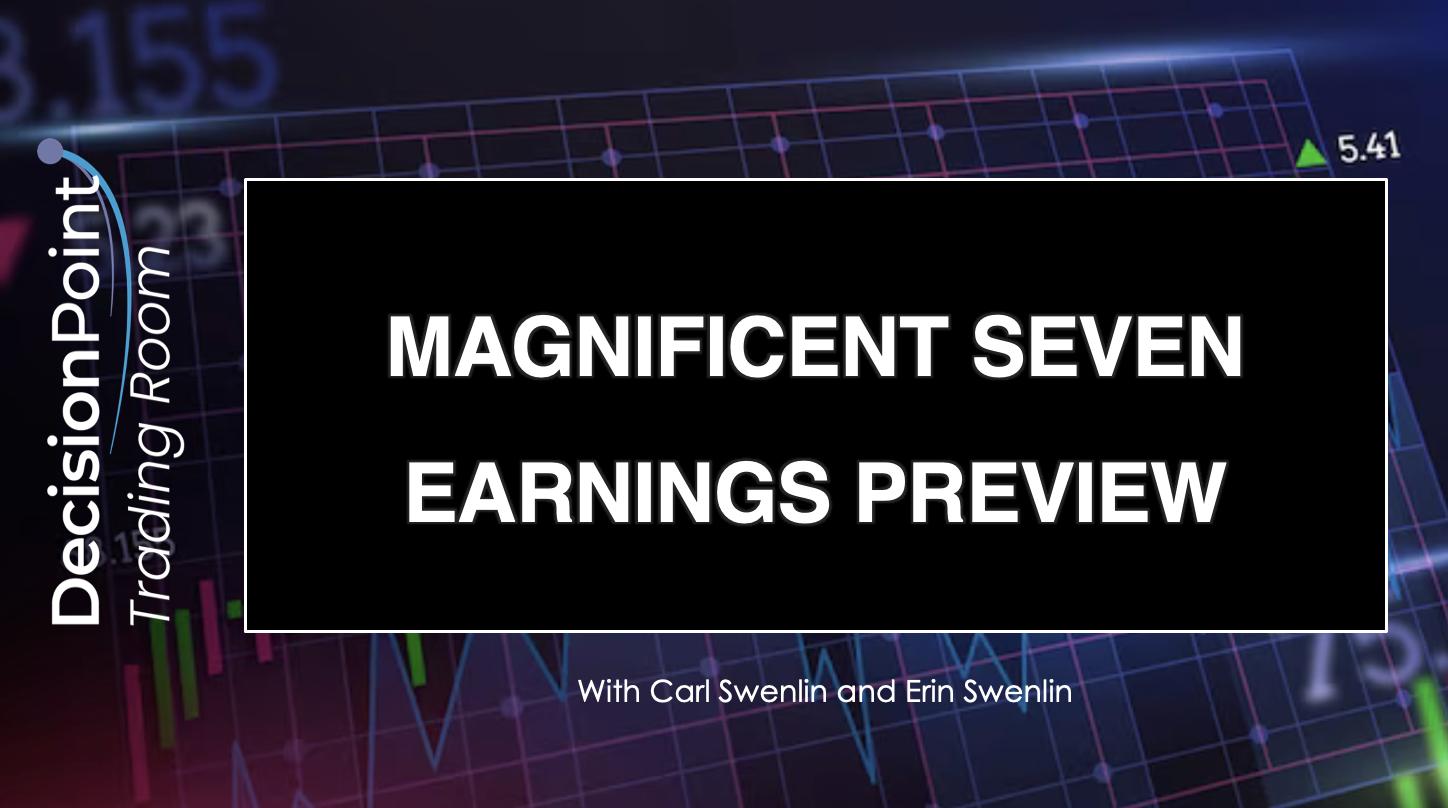
DP Trading Room: Magnificent Seven Earnings Preview
As part of today's coverage of the Magnificent Seven we remind you when the big mega-caps are reporting and give you are current perspective of each. We also cover all of the Magnificent Seven in the short and intermediate terms with daily and weekly charts Read More
Wyckoff Power Charting5mo ago

Secular Shenanigans
The secular bull market in stocks has been epic both in duration and extent. The NASDAQ 100 Index illustrates this bull run best of all. Using Wyckoff Method classic trendline construction techniques, the chart below illuminates this secular bull phenomena Read More
Art's Charts5mo ago

Two Indicators to Improve Your Edge
There are no magic bullets, but we can improve our trading edge by starting our selection process with two proven concepts: trend and momentum. These are perhaps the two most powerful forces in the market Read More
Analyzing India5mo ago

Week Ahead: NIFTY Violates Key Support Levels; Drags Resistance Lower
The over-deviated markets continued to extend their losses for the fourth week in a row. The Nifty remained largely under sustained selling pressure over the past five days, barring a few feeble attempts to stage a technical rebound Read More
Add-on Subscribers
OptionsPlay with Tony Zhang5mo ago
The Future of Options Trading: Real-Time Technical & Options Ideas
In the fast-paced world of trading, success often hinges on screening for the best ideas in real-time to find trading opportunities Read More
The MEM Edge5mo ago
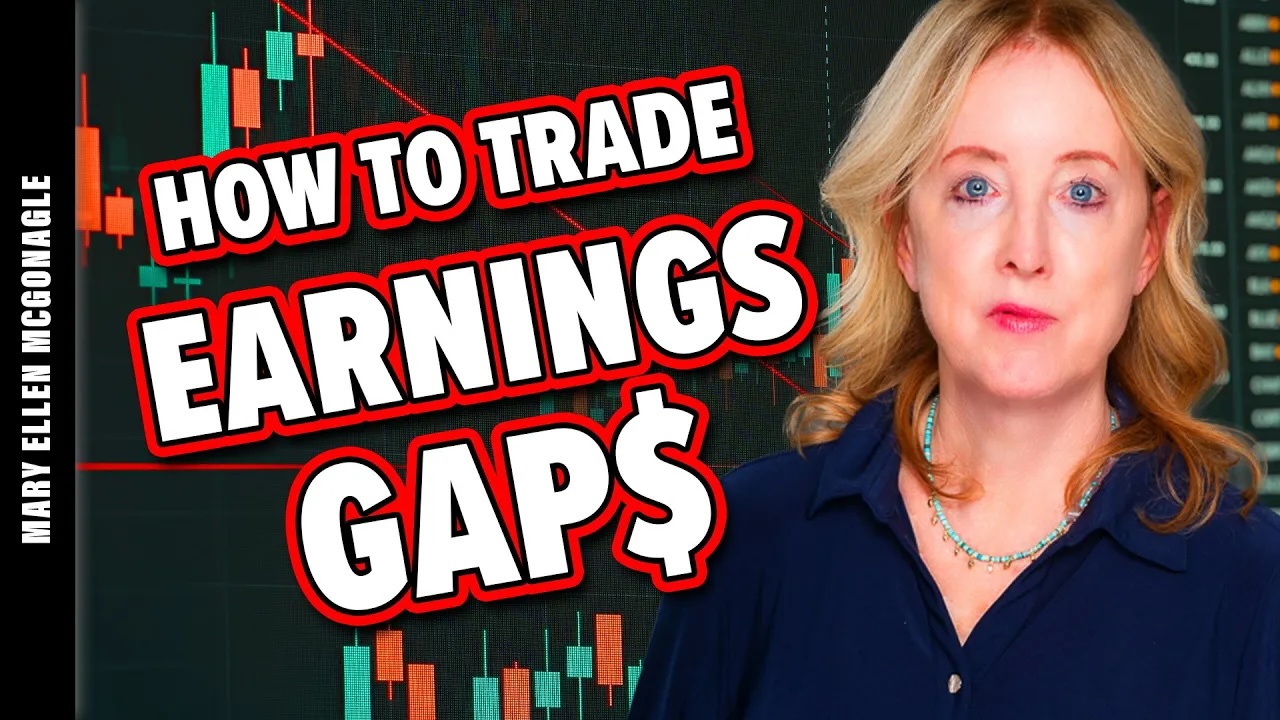
How to Trade Gaps Up (and Down) After Earnings
In this StockCharts TV video, Mary Ellen shares how the markets trade right before the elections, and also reviews the move in Tesla (TSLA) after reporting earnings. She shares examples of what to watch for if your stock is due to report earnings - and what to do if it gaps down Read More
ChartWatchers5mo ago
Election Season: Keep Calm and Optimize Your Portfolio
Although earnings season is in full swing, trading volume has been relatively light this week. Perhaps investors are waiting for the stock market to show some direction Read More
The Mindful Investor5mo ago
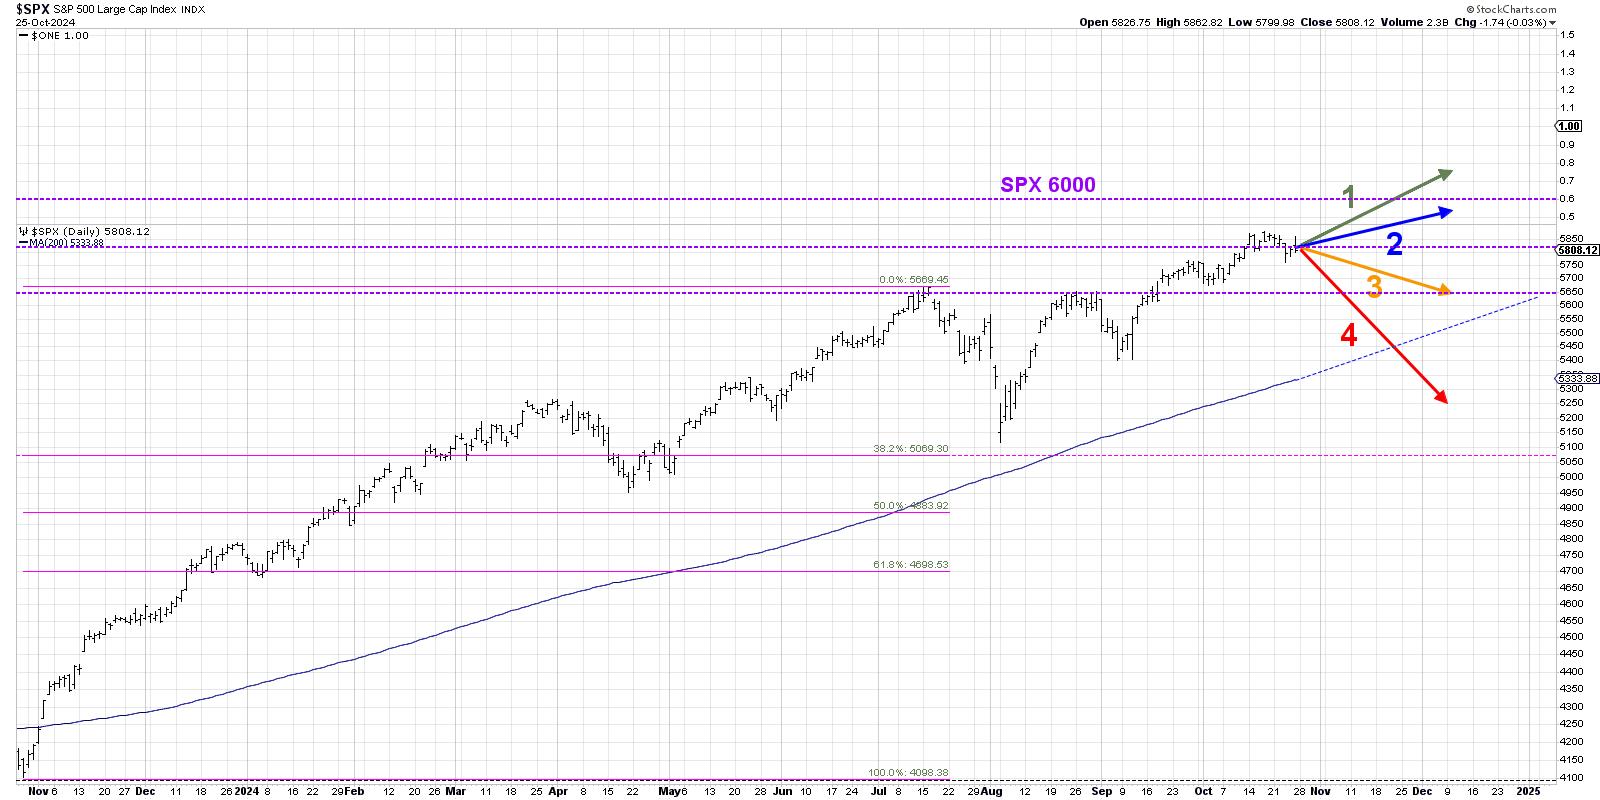
Why the S&P 500 Won't Break 6000 (Yet)
When I was growing up, I loved Choose Your Own Adventure books. I see the world in shades of gray instead of black-and-white, so I was immediately drawn to the seemingly endless scenarios that the main characters could experience as I made different choices for them Read More
RRG Charts5mo ago
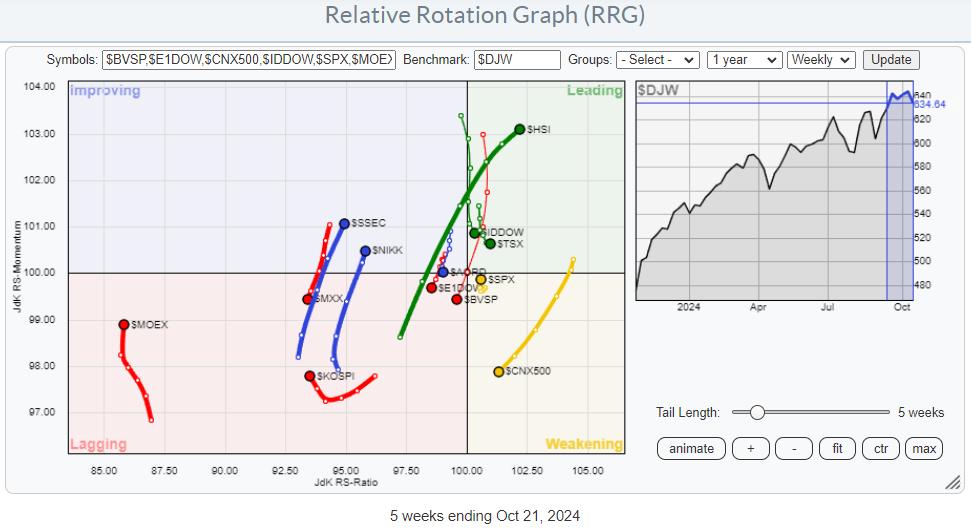
The US is Not the Only Stock Market in the World
The global stock market is a big place, and it extends far beyond the borders of the United States. While the US market is undeniably the largest and often sets the pace for others, it's revealing to step back and consider the global scene occasionally Read More
DecisionPoint5mo ago
PMO SELL Signals on All Indexes But One
In today's article and video, we'll discuss the weakness that pervades nearly all index charts. Over the past few days, many of the indexes have lost their PMO BUY Signals Read More
ChartWatchers5mo ago

SCTR Report: Unlocking TSLA's Potential—What Every Investor Needs to Know Now
Tesla (TSLA) reported better-than-expected earnings after the close on Wednesday. This sent the stock price soaring, which was enough to put TSLA stock in the lead in the Large Cap Top Up StockCharts Technical Rank (SCTR) Report category Read More
ChartWatchers5mo ago

Forex Secrets: How to Profit When EUR/USD Goes Nowhere
For stock investors, currency trading (a.k.a. Forex) can feel tricky—mostly because its structure and mechanics are not as straightforward as those of other financial instruments. And that's okay Read More
Members Only
Martin Pring's Market Roundup5mo ago
This Stock Market Will Likely Outperform the World Index, But Could Be Outshone by Something Completely Different
Since 2011, the US stock market, represented by the S&P Composite, has outperformed the world. In the last couple of weeks or so, it has managed to break out from a trading range in its relationship with the rest of the world and looks headed even higher on a relative basis Read More
Stock Talk with Joe Rabil5mo ago

My Favorite RSI Signal
In this exclusive StockCharts video, Joe shows how he sets up the RSI 20 and 5 in ACP to save space and improve analysis. He explains how he uses RSI for both reading the trend and for fine-tuning entry in a strong trend Read More
The Mindful Investor5mo ago

Three Ways to Visualize the Start of a Potential Distribution Phase
As we get into the meat of Q3 earnings season, I'm seeing a growing and concerning number of signs of distribution in the equity markets Read More
ChartWatchers6mo ago

Stocks Regain Some Ground Amid Rising Yields, Gold Prices, US Dollar
The overall trend in the stock market's broader indexes remains bullish. While the indexes were trading lower on Tuesday morning, they rebounded and ended the day relatively flat Read More
RRG Charts6mo ago

DISCOVER the Top Consumer Discretionary Stocks
In this video from StockCharts TV, Julius begins by looking back at the completed monthly bars for October to assess the long term trends in the 11 S&P sectors. He follows that up with an updated view for SPY in coming weeks Read More
Don't Ignore This Chart!6mo ago
Unlock the Secret To Finding Strong Stocks in Weak Markets
When the market is down, you can see which stocks Wall Street may be pumping money into. So on a Monday morning when the markets are down, this allows you to spot stocks that are bucking the intraday trend Read More
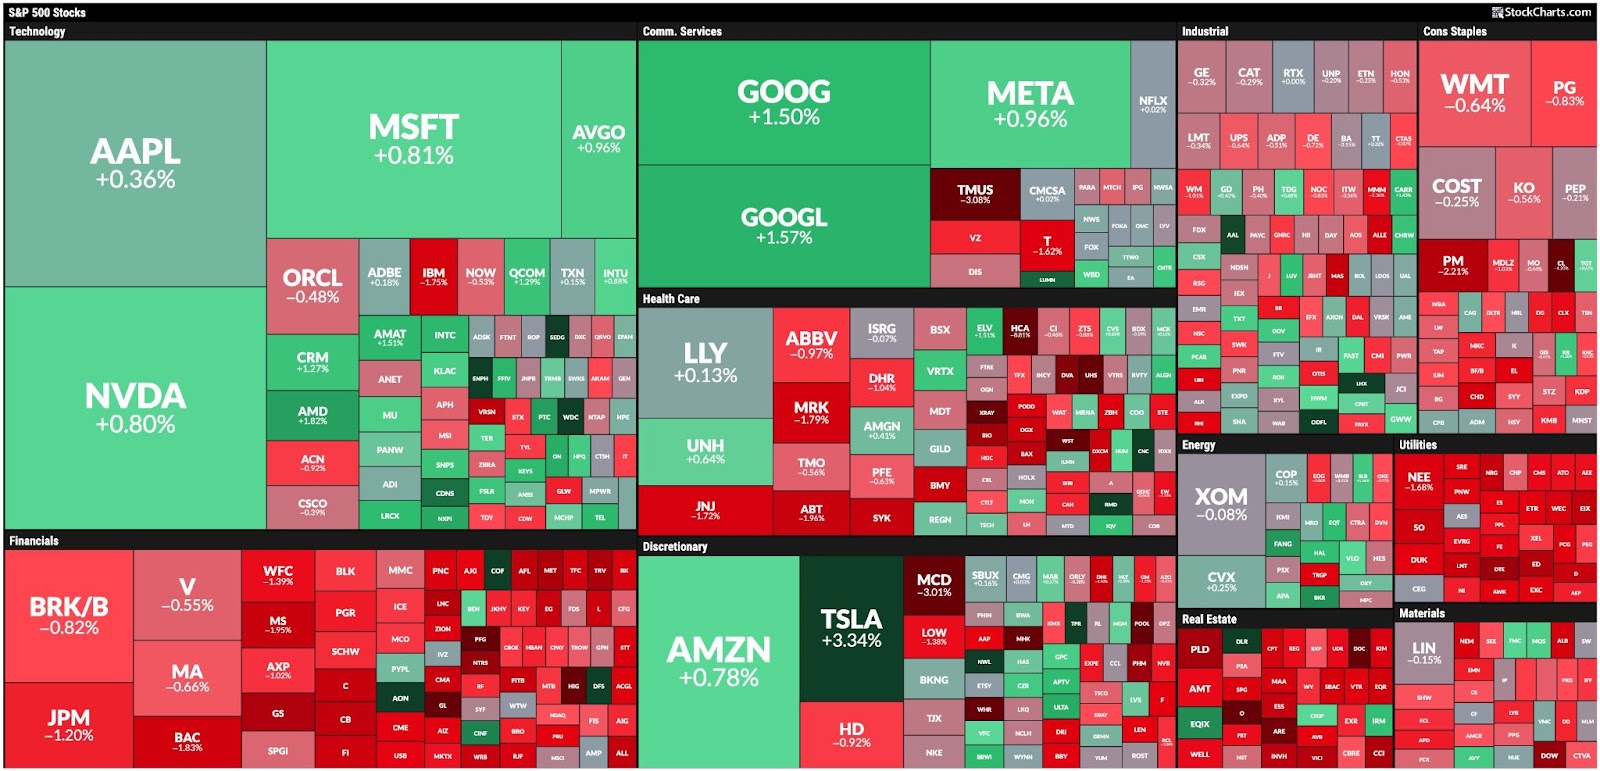
The Mindful Investor6mo ago
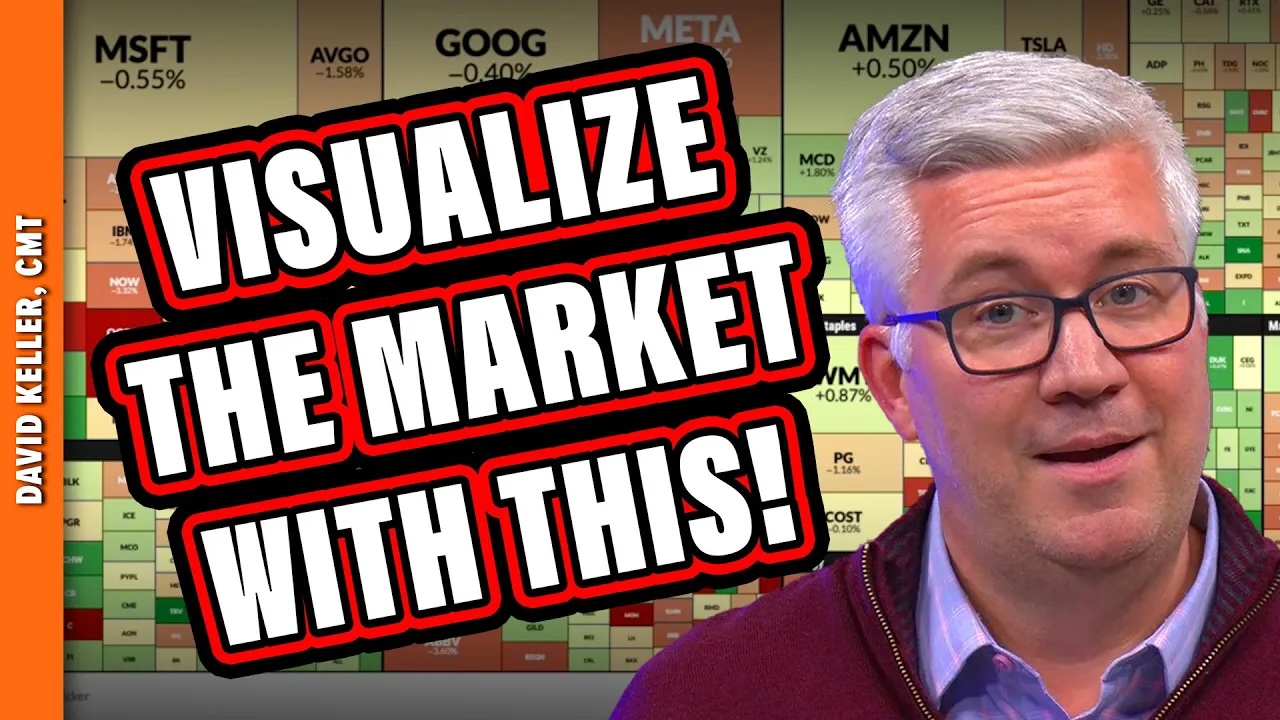
What's the BEST Market Visualization Tool?
How do you track movements of all the S&P 500 stocks on any given trading day? In this video, Dave will show you how he uses the StockCharts MarketCarpet to evaluate broad equity market conditions, assess the changes in the mega-cap stocks which dominate the benchmarks, and ident Read More
GoNoGo Charts6mo ago
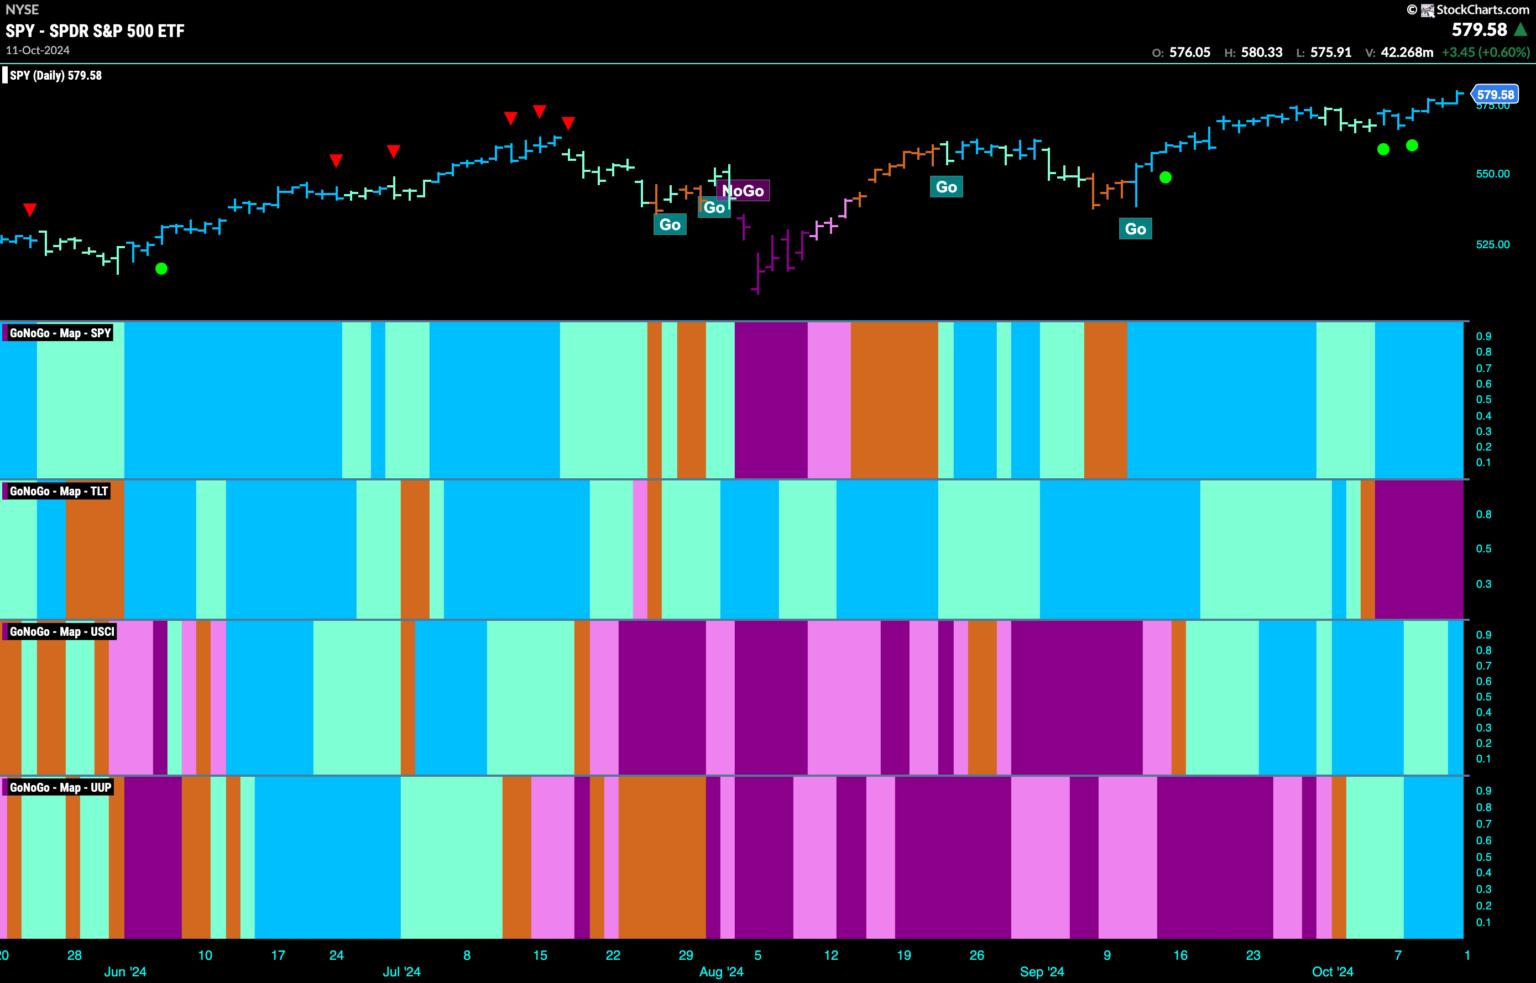
Equities Remain in "Go" Trend as We See Rotation into Utilities
Good morning and welcome to this week's Flight Path. Equities saw the "Go" trend continue this week as the indicator painted strong blue bars the entire week. Treasury bond prices saw the "NoGo" trend continue with a week of strong purple bars. U.S Read More
DecisionPoint6mo ago

DP Trading Room: Which is Better? SP600 (IJR) or Russell 2000 (IWM)
Carl explores which index is bestthe SP600 (IJR) or Russell 2000 (IWM). He makes a comparison over time and reveals which tends to be the better performer Read More
Trading Places with Tom Bowley6mo ago
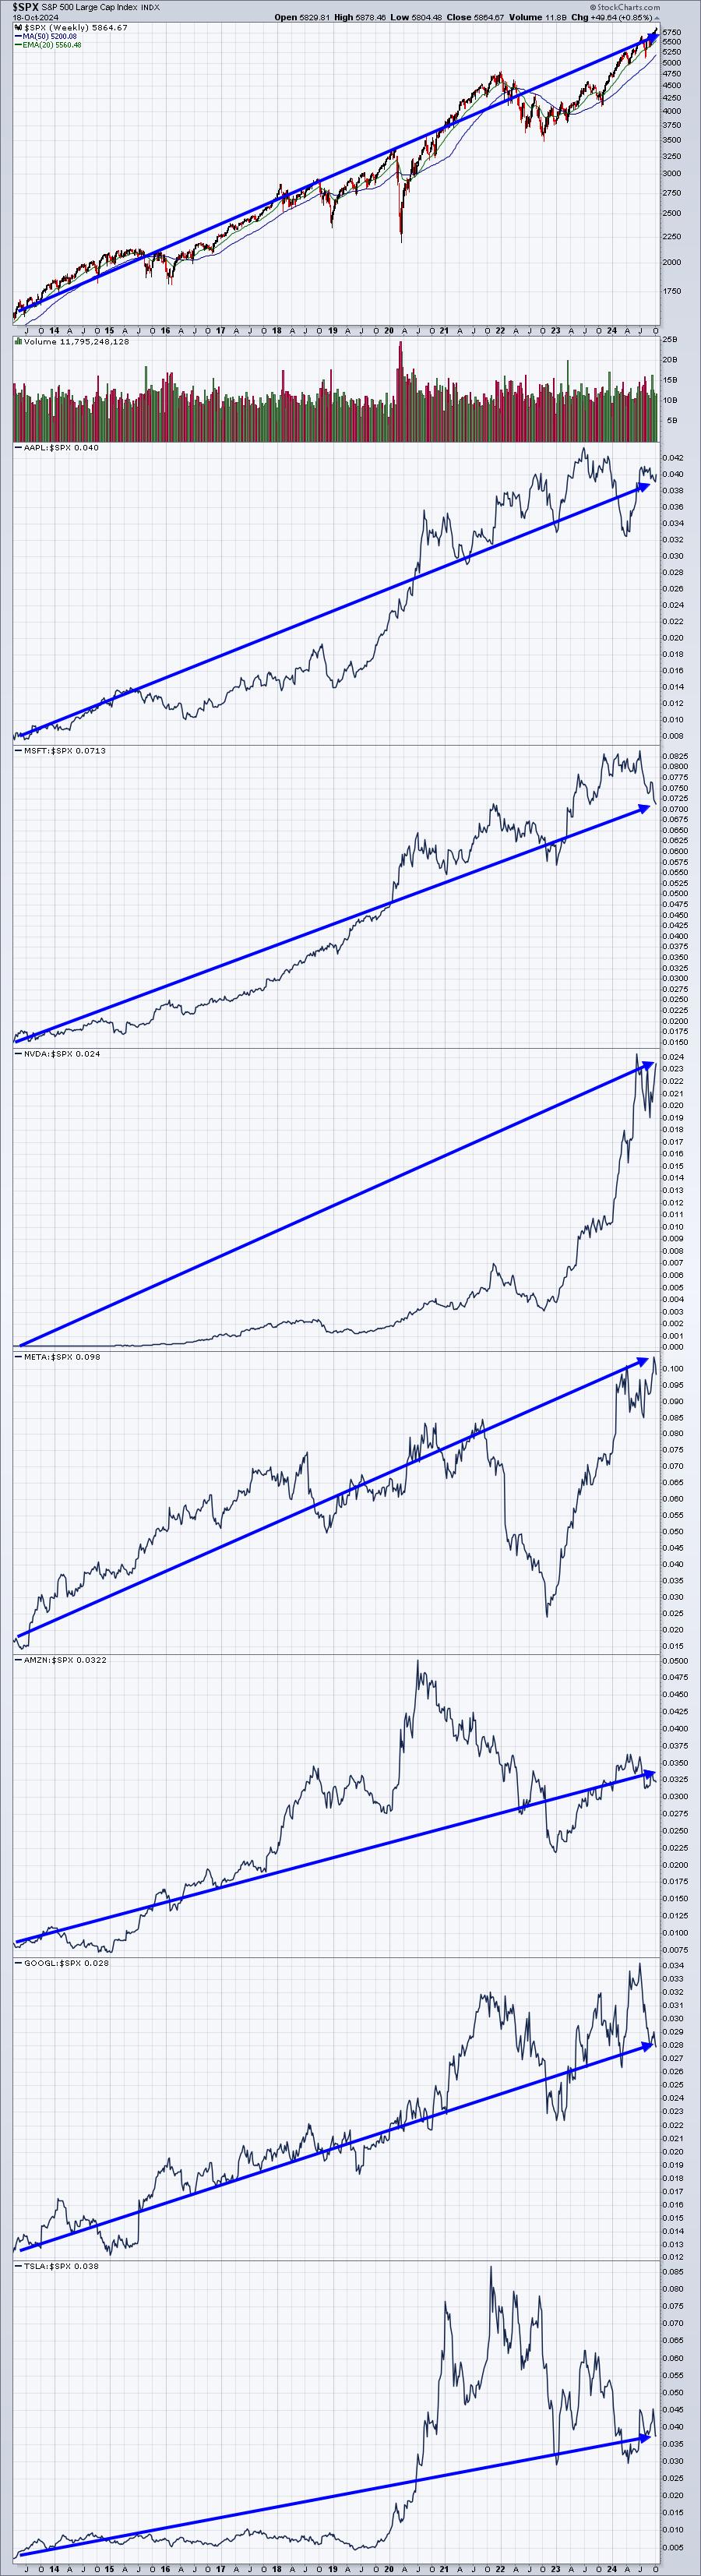
Only 3 Of The 7 Mag Stocks Are Worth Owning Right Now
The "Magnificent 7", comprised of Apple (AAPL), Microsoft (MSFT), NVIDIA (NVDA), Meta Platforms (META), Amazon.com (AMZN), Alphabet (GOOGL), and Tesla (TSLA) have carried the S&P 500 during this secular bull market - since its breakout in April 2013 above its 2000 and 2007 highs Read More
Analyzing India6mo ago

Week Ahead: NIFTY May Stay Ranged; Trending Moves to Occur Only If These Edges are Breached
The markets closed on a negative note for the third week in a row; over the past five sessions, the Nifty remained largely on a declining trajectory, except for the last trading day where it saw some relief rally from the lower levels Read More
The MEM Edge6mo ago

Be On the Lookout for THIS During Earnings Season!
In this StockCharts TV video, Mary Ellen reviews what's driving the markets higher and how you can capitalize. Moves in TSLA, NVDA, and NFLX are highlighted. She also reviews price action greatly impacted by earnings, many driven by analyst upgrades and downgrades Read More
The Mindful Investor6mo ago
Does the MACD Histogram Hold the Secret to Anticipating Trend Changes?
The Moving Average Convergence/Divergence (MACD) indicator, created by technical analyst Gerald Appel, is a technical indicator designed to confirm once a trend change has occurred Read More
ChartWatchers6mo ago

A Strong Week: Stocks, Gold, and Crypto's Robust Performance
Despite a light economic data week, the stock market continued its rally, with the S&P 500 ($SPX) and the Dow Jones Industrial Average ($INDU) closing at record highs. How many times have we heard that? This is the sixth positive week for the three indexes Read More
Members Only
Larry Williams Focus On Stocks6mo ago
Is This Still a Bull Market? | Larry's "Family Gathering" October 18, 2024 Recording
RRG Charts6mo ago
Using RRG To Find Best Three Stocks inside the DJ Industrials Index
In this week's RRG video, I shared my concerns about the current market conditions. The sector rotation model and current sector rotation, as we see it on the Relative Rotation Graph for US sectors, are sending us conflicting signals Read More
Add-on Subscribers
OptionsPlay with Tony Zhang6mo ago
Disney Stock Options Strategy: A Detailed Guide to Boost Your Earnings
Walt Disney Co. (DIS) has struggled as a business over the past few years and isn't on many investors' radars these days. However, Disney seems to have turned a corner last quarter and is positioned for a resurgence in its core theme parks and streaming businesses Read More
Members Only
Larry Williams Focus On Stocks6mo ago
Final "Family Gathering" Meeting Today at 2 PM Eastern
Popular Articles

This is the Group to Watch for the Next Bull Market Phase and Separating Noise from Reality

An Oversold Bounce is One Thing - A Bullish Breadth Thrust is Another

When in Doubt, Follow the Leadership

Bullish Percent Index Confirms Short-Term Rebound

200-Day Moving Average Confirms Bearish Phase

Stay Ahead of the Stock Market: Key Bond Market Signals Explained with Charts
Get expert technical commentary delivered straight to your inbox! Sign up for our FREE weekly ChartWatchers Newsletter. Learn More
Featured Authors


Public ChartList Leaders


StockCharts Members unlock complete access to the Stocks & Commodities Magazine archives. Read the latest articles or browse past editions.