Art's Charts August 27, 2015 at 08:59 AM
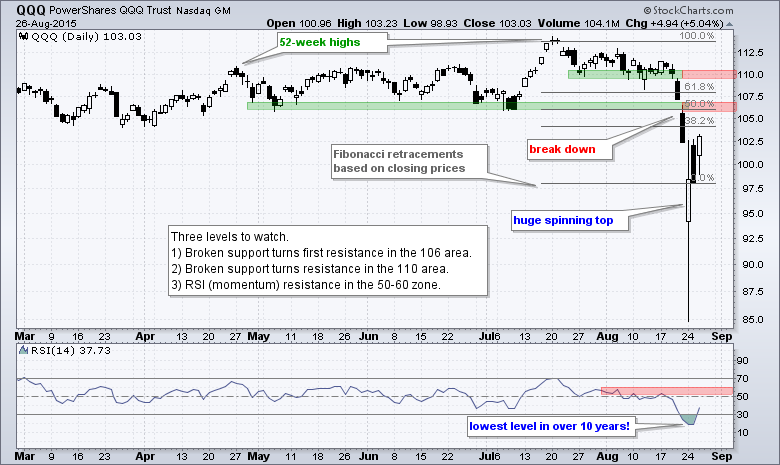
Setting Upside Targets for the Big 3 We are going to start with some candlestick charts so chartists can see the volatility of the last few days. There are few things to note overall... Read More
Art's Charts August 25, 2015 at 12:37 PM
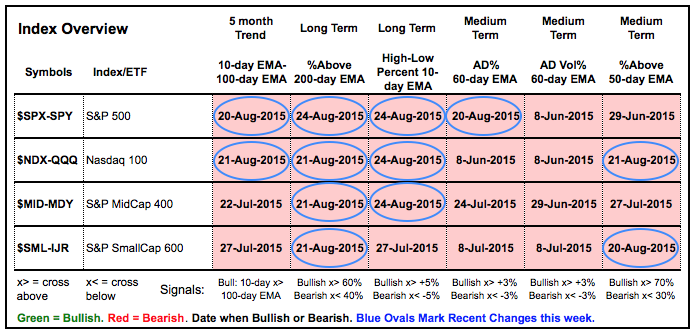
Index Table Turns Deep Red The charts and commentary are part of Tuesday's webinar. Click here for the recording. Unsurprisingly, the breadth-trend table has turned decidedly bearish over the last few days... Read More
Art's Charts August 20, 2015 at 10:17 AM
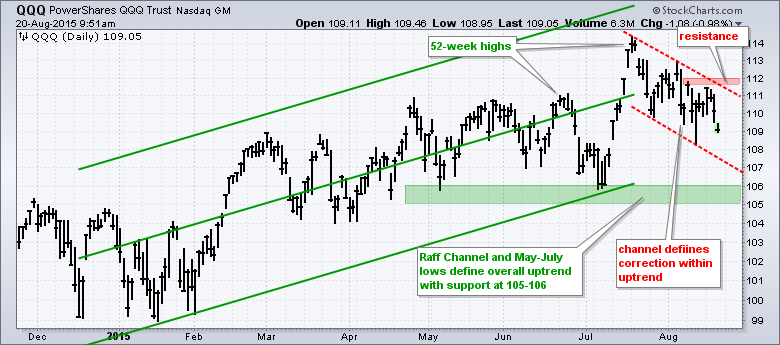
The major index ETFs remain in corrective mode, but two of the four are close to breaking long-term support levels. The challenge with corrections is we never know which corrections will evolve into bigger downtrends... Read More
Art's Charts August 18, 2015 at 12:04 PM
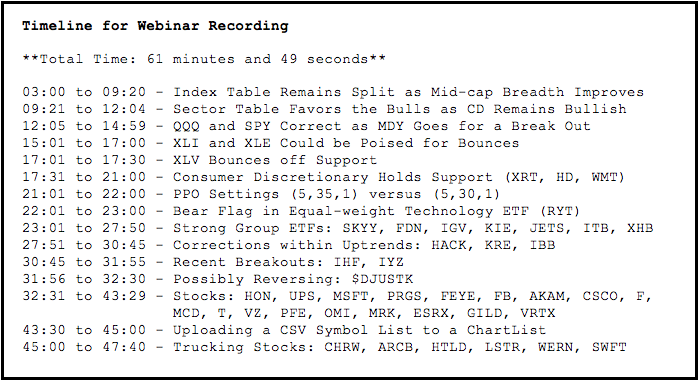
Today's webinar and commentary will take a top down look at the stock market. First, the index table with the breadth indicators shows a split market with half bullish and half bearish... Read More
Art's Charts August 14, 2015 at 04:51 AM
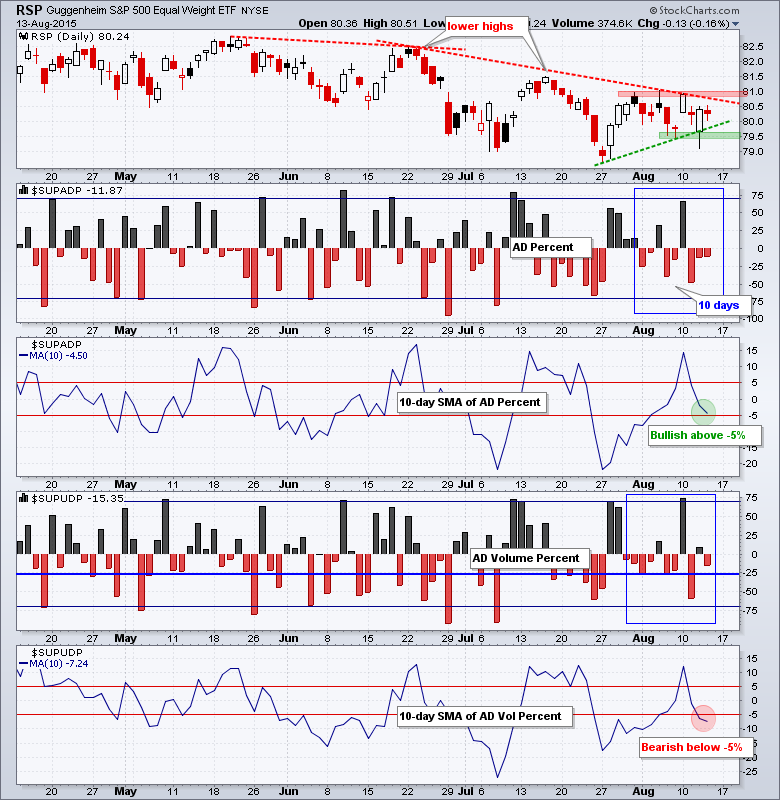
Stocks chopped around on Thursday and the major index ETFs ended the day with little change. The Dow Diamonds (DIA) was up .06% and the S&P 500 SPDR (SPY) was down .12%, twice as much as DIA, but still a fraction. Consumer discretionary and finance led, while energy lagged... Read More
Art's Charts August 13, 2015 at 05:14 AM
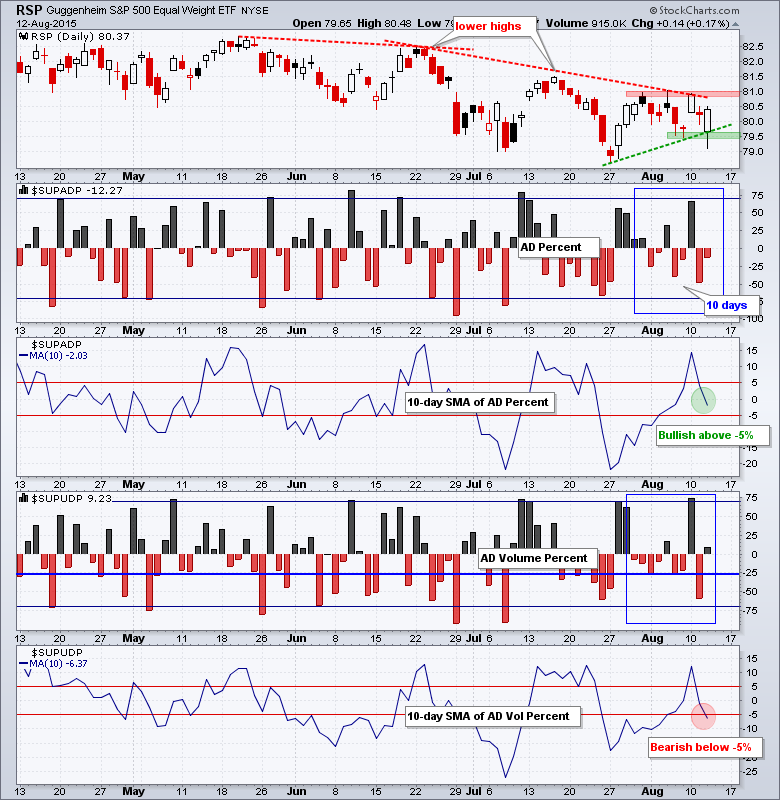
Stocks started the day under selling pressure as the S&P 500 fell around 1.5% in the first hour trading. The buyers then stepped in and pushed the index above its prior close for a small gain. The big hammer candlestick formed as a result... Read More
Art's Charts August 12, 2015 at 04:57 AM
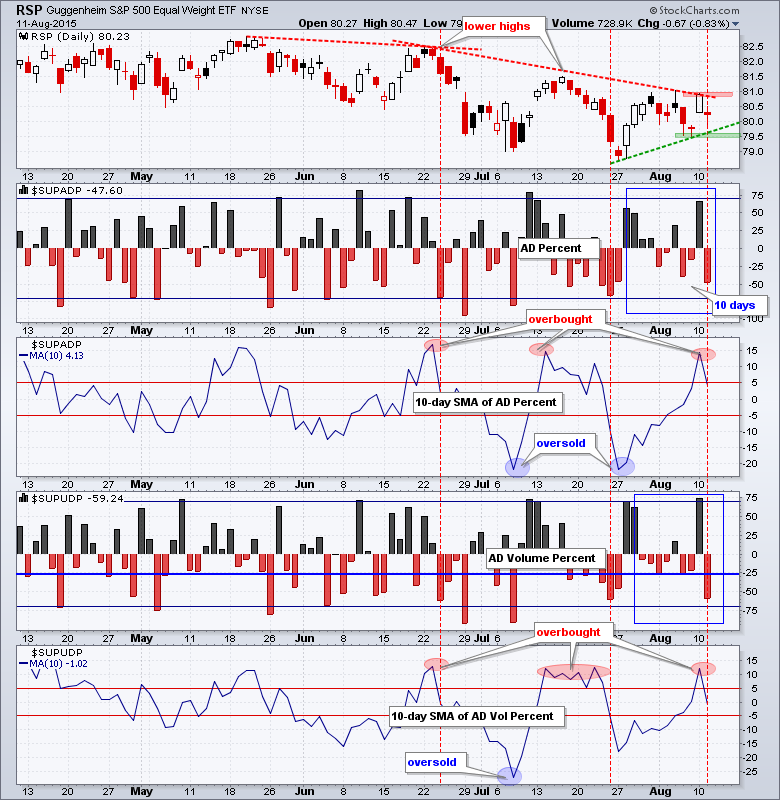
Easy come, easy go. Stocks surged on Monday and then gave it back on Tuesday. Most sectors and industry groups were hit with selling pressure on Tuesday... Read More
Art's Charts August 11, 2015 at 04:30 AM
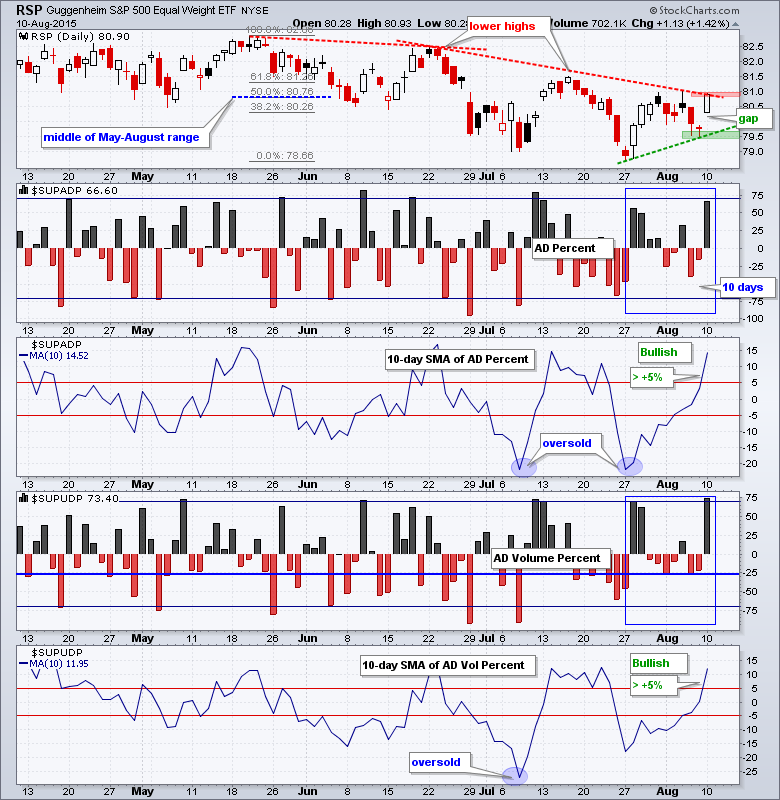
Stocks rallied with a broad advance that lifted most boats. The sectors and industry groups that were hit the hardest over the last few months got the biggest bounces. These include energy, materials, mining, gold and steel... Read More
Art's Charts August 10, 2015 at 05:45 AM
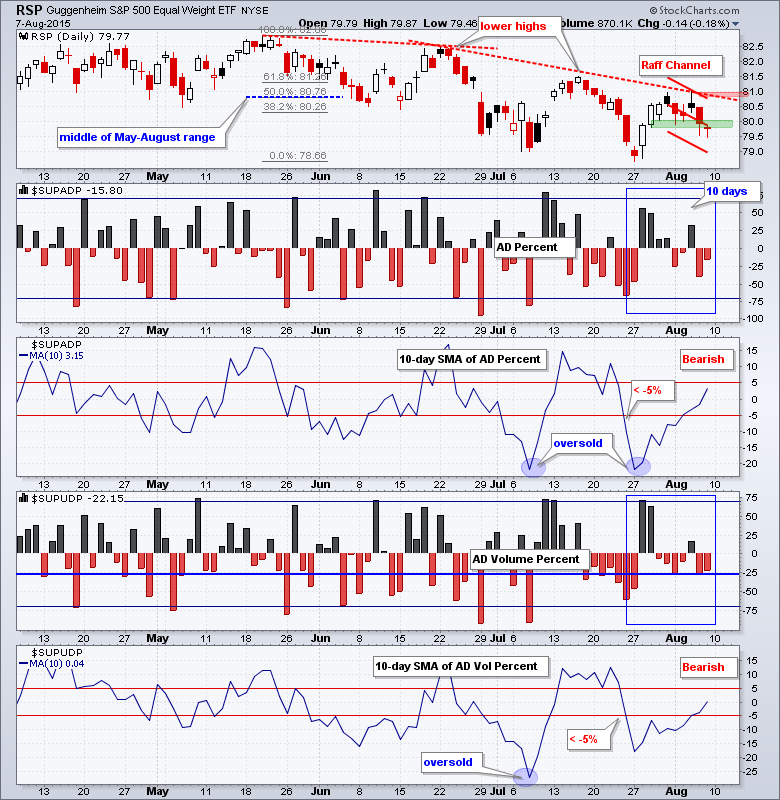
Stocks were hit with selling pressure last week, but it was not that intense. QQQ lost 1.5%, SPY declined 1.2% and IWM was down 2.5%. Small-caps remain relatively weak and continue to lead on the way down... Read More
Art's Charts August 07, 2015 at 05:06 AM
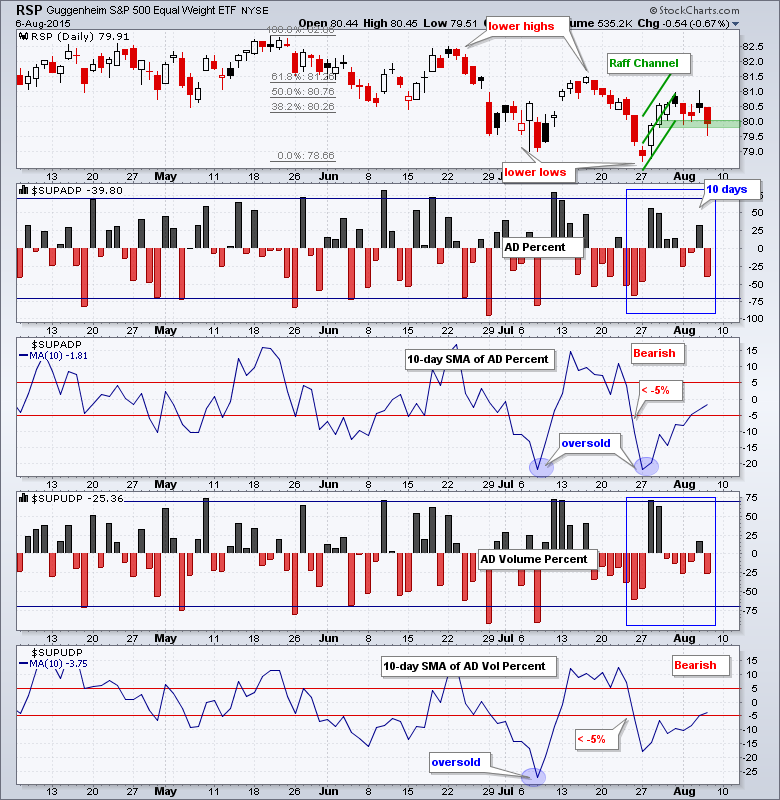
Stocks were hit with selling pressure on Thursday with QQQ leading the way lower. Actually, the Nasdaq 100 Equal-Weight ETF (QQEW) led with a 2% decline because selling pressure in the technology sector was quite broad... Read More
Art's Charts August 06, 2015 at 07:00 AM
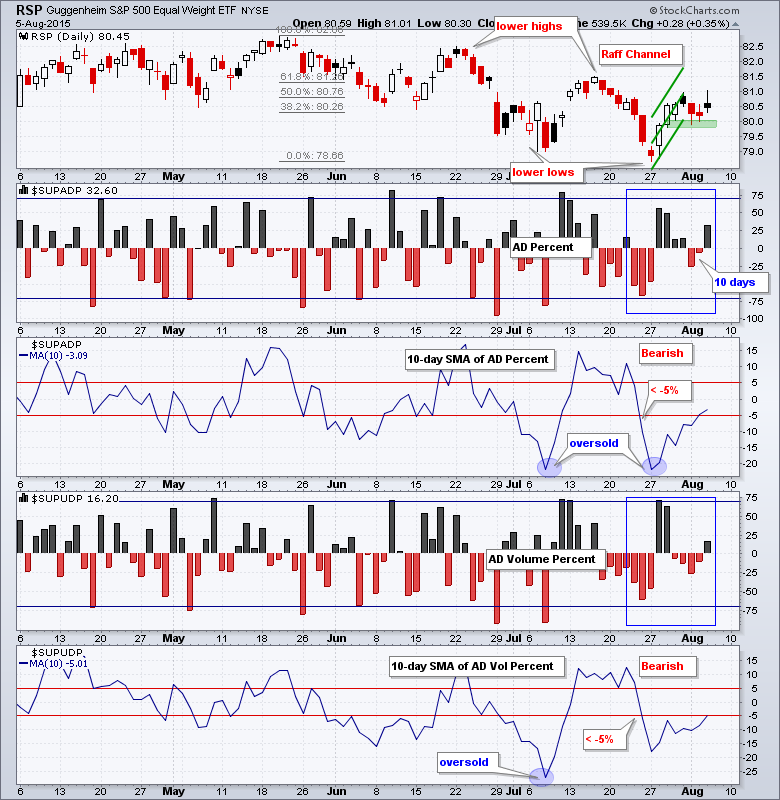
Stocks caught an early bid and even held their gains to close positive. There was no follow through to the morning pop so traders can read into this as they please. The bears will point to no follow through, while the bulls will point to the ability to hold gains... Read More
Art's Charts August 05, 2015 at 05:52 AM
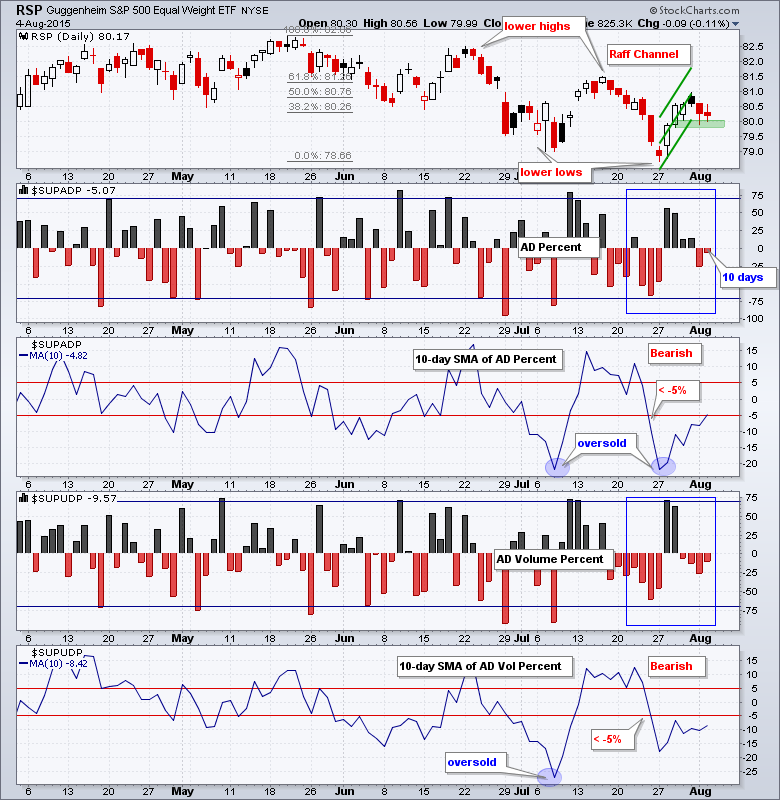
Stocks were all mixed up with no place to go on Tuesday. The Nasdaq 100 Equal-Weight ETF (QQEW), which treats Apple as a mere mortal, managed a small gain to lead the major index ETFs. The rest were down fractionally... Read More
Art's Charts August 04, 2015 at 04:57 AM
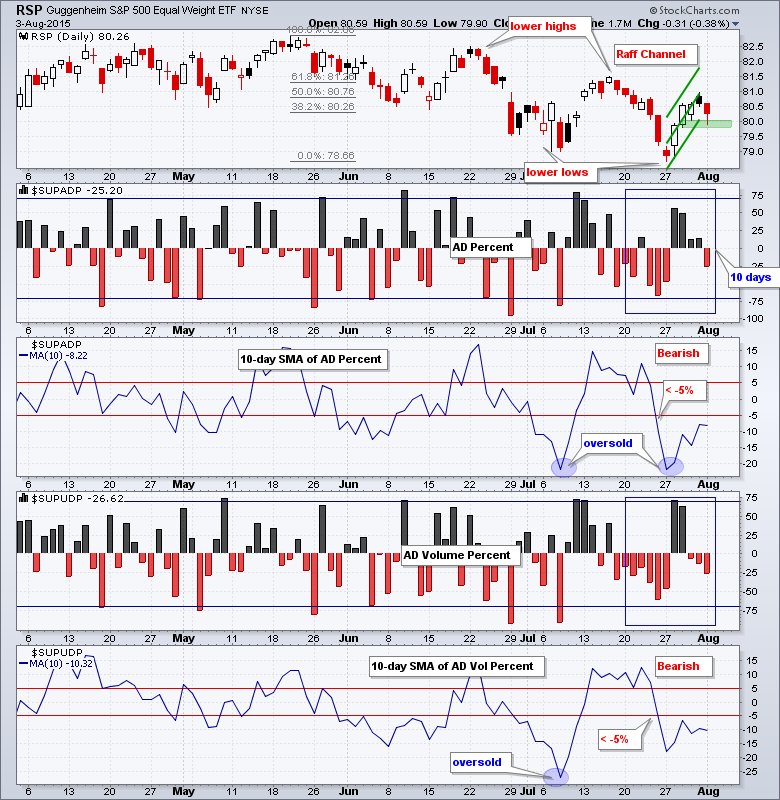
Let the choppiness begin. Or rather, let the choppiness continue. Stocks started flat, moved lower around noon and then bounced in the final hour. The major index ETFs still finished down on the day, but the declines were fractional and they managed to close off their lows... Read More
Art's Charts August 03, 2015 at 06:07 AM
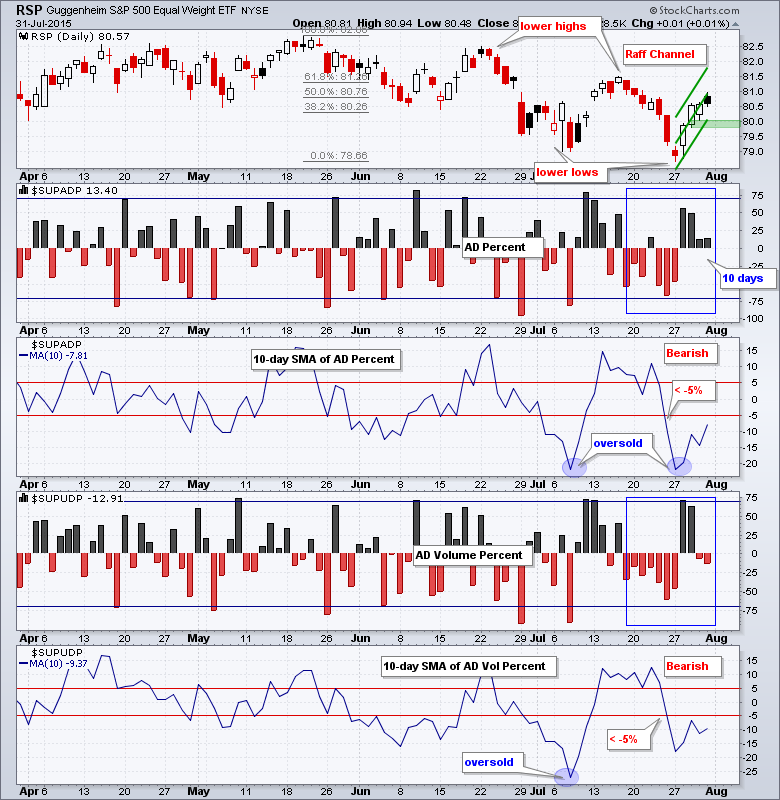
It was a choppy week, but the major index ETFs managed to finish with small gains. The S&P MidCap SPDR (MDY) led with a 1.85% advance and QQQ lagged with a .77% gain. The sectors were mostly higher with industrials, materials and healthcare leading... Read More