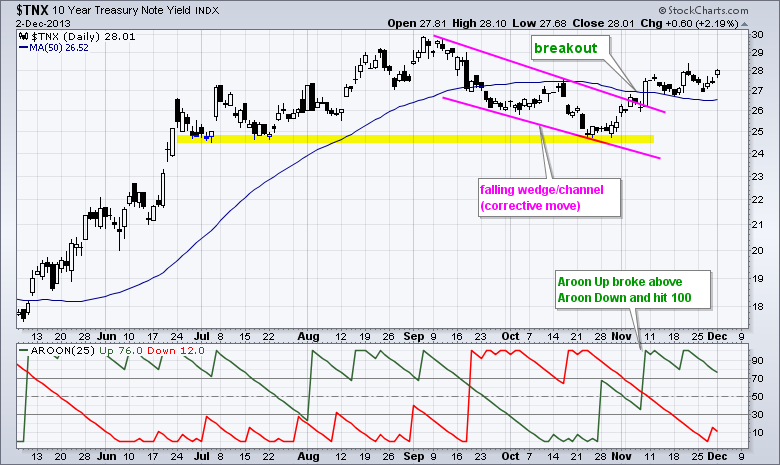
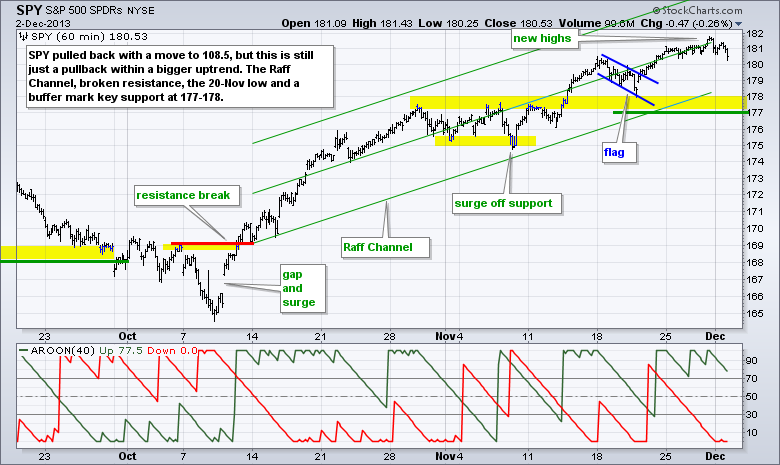
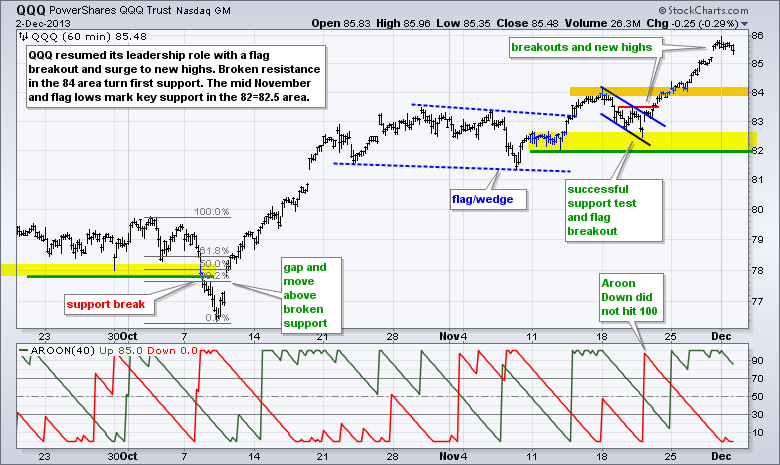
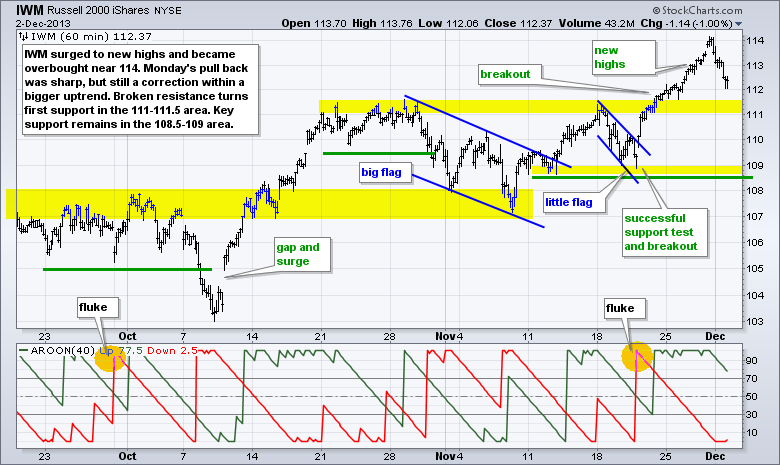
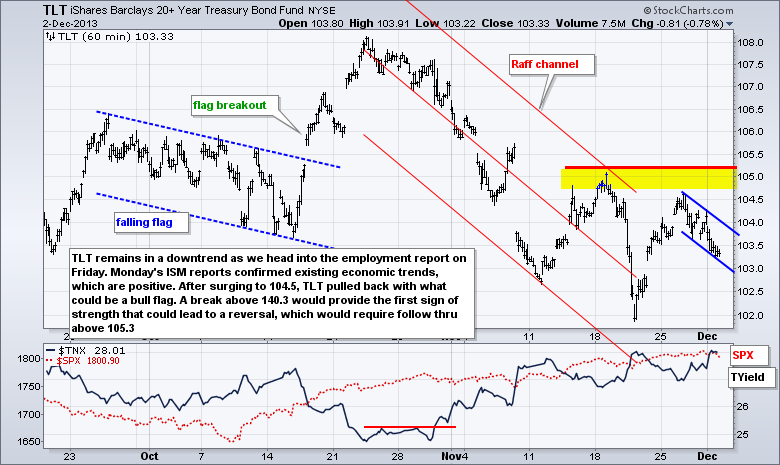
After a two week surge at the end of November, stocks started December with some selling pressure. Small-caps and micro-caps led the two week surge, and the Monday pullback. The Russell 2000 ETF (IWM) fell 1% and the Russell Micro Cap ETF (IWC) fell 1.44%. The sectors were mixed with two up and seven down. The sector gains and losses, however, were modest though. The Home Construction SPDR (ITB) came under selling pressure as the 10-YR Treasury Yield ($TNX) edged above 2.8%. $TNX broke its 50-day moving average with a surge in early November and continues to hold this breakout. Treasuries will remain in the spot light because there are several key economic reports, including Auto-Truck sales on Tuesday, ISM Services on Wednesday and the employment report on Friday. Yesterday, the ISM Manufacturing Index beat expectations and rose to 57.3 in November, which was the highest reading since April 2011. The glass is clearly half full when it comes to the economy and I expect the employment numbers to confirm this. Treasuries are likely to remain under pressure and this means interest rates could rise further, which may affect some interest sensitive stocks (utilities, homebuilders, REITs).
**This chart analysis is for educational purposes only, and should not
be construed as a recommendation to buy, sell or sell-short said securities**
**************************************************************
**************************************************************
**************************************************************
**************************************************************
***************************************************************
Key Reports and Events (all times Eastern):
Mon - Dec 02 - 10:00 - ISM Manufacturing Index
Mon - Dec 02 - 10:00 - Construction Spending-Sep
Mon - Dec 02 - 10:00 - Construction Spending-Oct
Tue - Dec 03 - 14:00 - Auto/Truck Sales
Wed - Dec 04 - 07:00 - MBA Mortgage Index
Wed - Dec 04 - 08:15 - ADP Employment Report
Wed - Dec 04 - 10:00 - New Home Sales-Sep
Wed - Dec 04 - 10:00 - New Home Sales-Oct
Wed - Dec 04 - 10:00 - ISM Services Index
Wed - Dec 04 - 10:30 - Crude Oil Inventories
Wed - Dec 04 - 14:00 - Fed Beige Book
Thu - Dec 05 - 07:30 - Challenger Job Report
Thu - Dec 05 - 08:30 - Initial Jobless Claims
Thu - Dec 05 - 08:30 - GDP
Thu - Dec 05 - 10:00 - Factory Orders
Thu - Dec 05 - 10:30 - Natural Gas Inventories
Fri - Dec 06 - 08:30 - Employment Report
Fri - Dec 06 - 08:30 - Personal Income & Spending
Fri - Dec 06 - 09:55 - Michigan Sentiment
Fri - Dec 13 - 23:59 - Congressional Budget Deadline
Charts of Interest: Tuesday and Thursday
This commentary and charts-of-interest are designed to stimulate thinking. This analysis is not a recommendation to buy, sell, hold or sell short any security (stock ETF or otherwise). We all need to think for ourselves when it comes to trading our own accounts. First, it is the only way to really learn. Second, we are the only ones responsible for our decisions. Think of these charts as food for further analysis. Before making a trade, it is important to have a plan. Plan the trade and trade the plan. Among other things, this includes setting a trigger level, a target area and a stop-loss level. It is also important to plan for three possible price movements: advance, decline or sideways. Have a plan for all three scenarios BEFORE making the trade. Consider possible holding times. And finally, look at overall market conditions and sector/industry performance.

