Despite all this talk on the fiscal cliff, it seems that the Euro is more important to the stock market right now. On the 60-minute chart, the indicator window shows the Euro Currency Trust (FXE) bottoming on 13-Nov and the S&P 500 ETF (SPY) bottoming on 16-Nov. Both moved higher the last two weeks to reinforce their positive correlation. Strength in the Euro favors the risk-on trade, which in turn favors stocks and commodities.
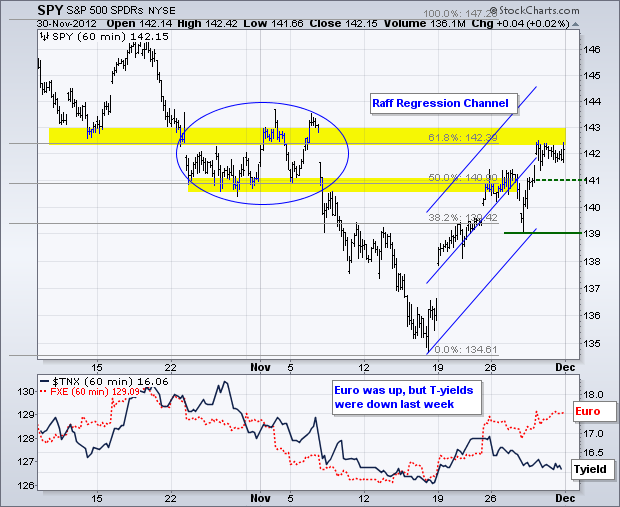

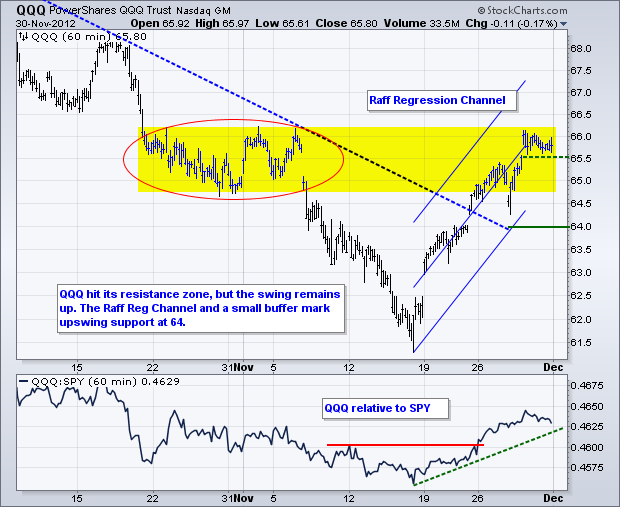
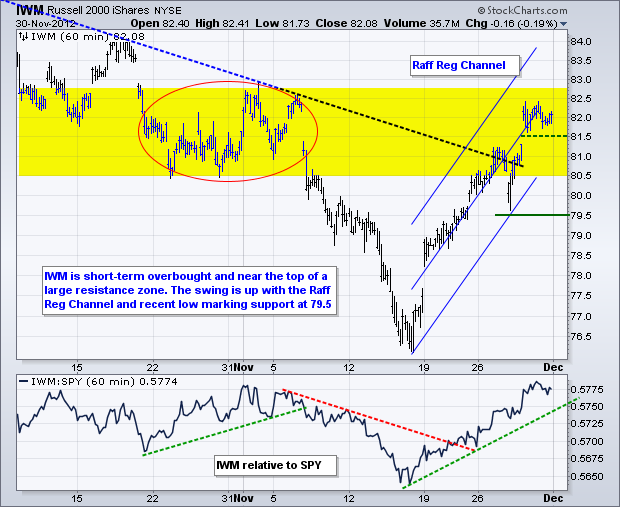
I am however, concerned with last week's decline in the 10-year Treasury Yield ($TNX) because stocks and yields are also positively correlated. The decline in yields and rise in treasuries suggests economic weakness, which is negative for stocks. On the price chart, SPY is trading near the top of a resistance zone. The 61.80% retracement, broken support and the early November highs mark resistance here. Despite resistance and short-term overbought conditions, there are no signs of weakness and the short-term trend remains up. A break below minor support at 141 would provide the first sign of weakness. The Raff Regression Channel and mid week low mark key support at 139.
**************************************************************************
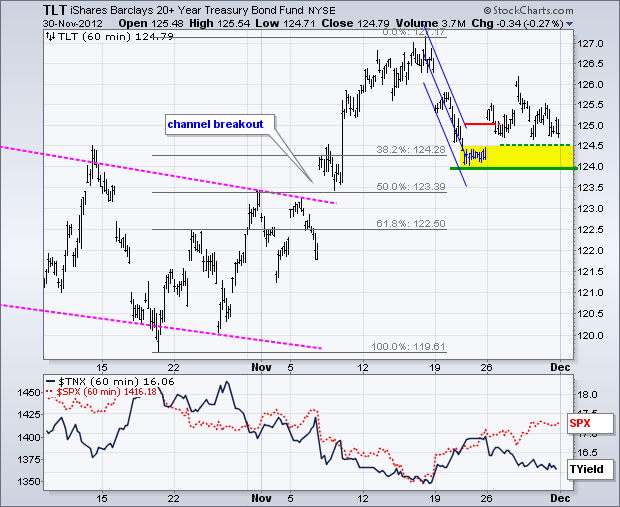
This is going to be a big week for the bond market. Factory Orders and ISM Services will be reported on Wednesday and the big employment report is due out on Friday. The 20+ Year T-Bond ETF (TLT) is holding its early November breakout as broken resistance turns into support in the 124 area. The bulls still get the benefit of the doubt here. TLT surged to start the week, but fell back as stocks rallied on Wednesday-Thursday. A break below key support at 124 would be bearish for TLT and bullish for stocks.
**************************************************************************
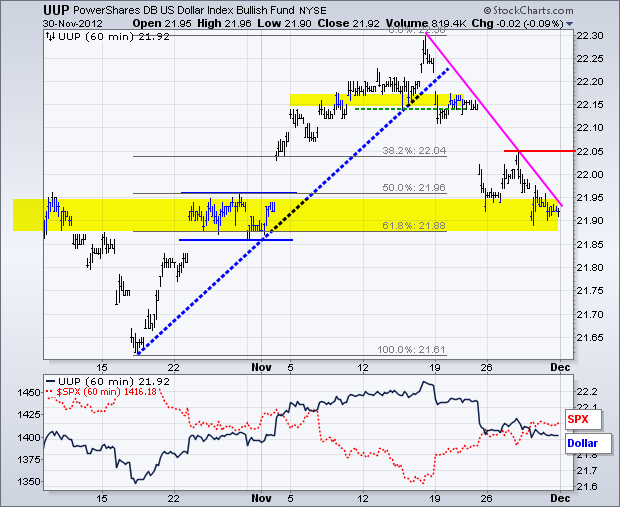
The US Dollar Fund (UUP) faltered last week and the short-term trend is down, but the ETF remains in a potential reversal zone that warrants a close watch. There is potential support in the 21.9-21.95 area from broken resistance and the 50-61.80% retracement zone. Resistance is set at 22.05 and it would take a break above this level to reverse the current downswing. A continued downswing would be bullish for stocks, while an upside breakout would be bearish.
**************************************************************************
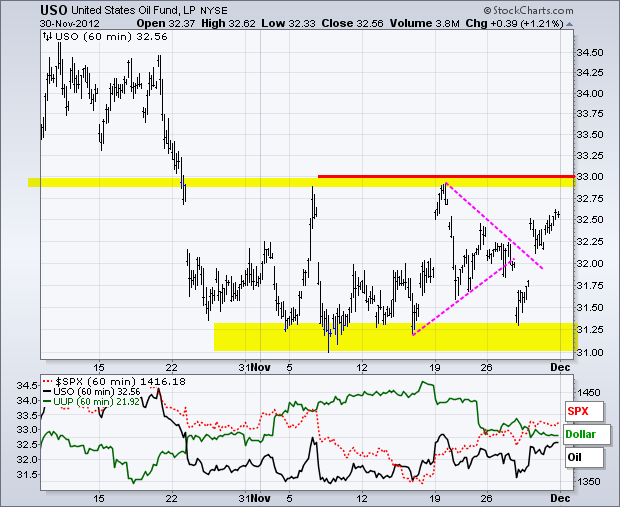
The US Oil Fund (USO) remains directionless overall as it gyrates above/below the 32 level. Strength in US and European stocks should be positive for oil. Weakness in the Dollar should be bullish as well. Should these intermarket trends continue, oil could break resistance at 33 to reverse the short-term and medium-term downtrends. Watch out below if stocks turn down and the Dollar turns up.
**************************************************************************
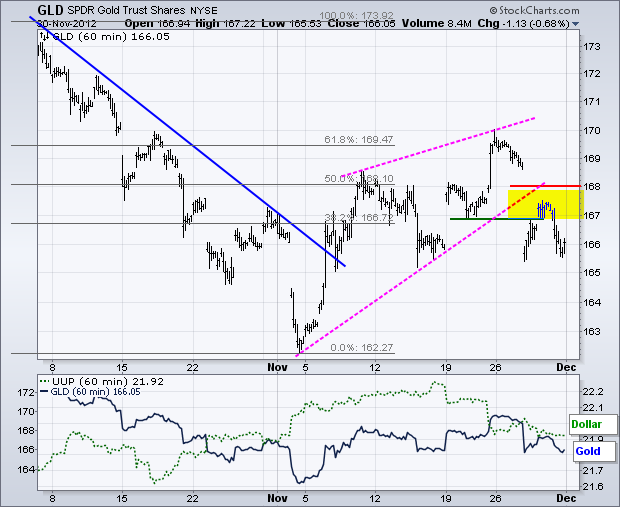
Even though the Dollar extended its downtrend and the stock market continued its uptrend last week, the Gold SPDR (GLD) broke down with a sharp decline below 167. This move broke rising wedge support to signal a continuation of the October decline. Overall, GLD has been in a trading range since October 2011 (148 – 175). Broken support turns resistance in the 167-168 area.
**************************************************************************
Key Reports and Events:
Mon - Dec 03 - 10:00 - ISM Manufacturing Index
Mon - Dec 03 - 10:00 - Construction Spending
Mon - Dec 03 - 14:00 - Auto/Truck Sales
Wed - Dec 05 - 07:00 - MBA Mortgage Index
Wed - Dec 05 - 08:15 - ADP Employment Report
Wed - Dec 05 - 10:00 - Factory Orders
Wed - Dec 05 - 10:00 - ISM Services Index
Wed - Dec 05 - 10:30 - Oil Inventories
Thu - Dec 06 - 07:30 - Challenger Job Cuts
Thu - Dec 06 - 08:30 - Jobless Claims
Fri - Dec 07 - 08:30 - Employment Report
Fri - Dec 07 - 09:55 - Michigan Sentiment
Charts of Interest: Tuesday and Thursday
This commentary and charts-of-interest are designed to stimulate thinking. This analysis is not a recommendation to buy, sell, hold or sell short any security (stock ETF or otherwise). We all need to think for ourselves when it comes to trading our own accounts. First, it is the only way to really learn. Second, we are the only ones responsible for our decisions. Think of these charts as food for further analysis. Before making a trade, it is important to have a plan. Plan the trade and trade the plan. Among other things, this includes setting a trigger level, a target area and a stop-loss level. It is also important to plan for three possible price movements: advance, decline or sideways. Have a plan for all three scenarios BEFORE making the trade. Consider possible holding times. And finally, look at overall market conditions and sector/industry performance.

About the author:
Arthur Hill, CMT, is the Chief Technical Strategist at TrendInvestorPro.com. Focusing predominantly on US equities and ETFs, his systematic approach of identifying trend, finding signals within the trend, and setting key price levels has made him an esteemed market technician. Arthur has written articles for numerous financial publications including Barrons and Stocks & Commodities Magazine. In addition to his Chartered Market Technician (CMT) designation, he holds an MBA from the Cass Business School at City University in London.
Learn More