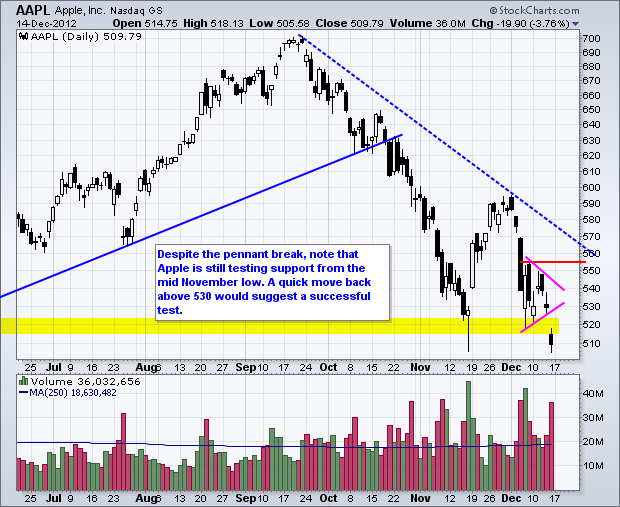
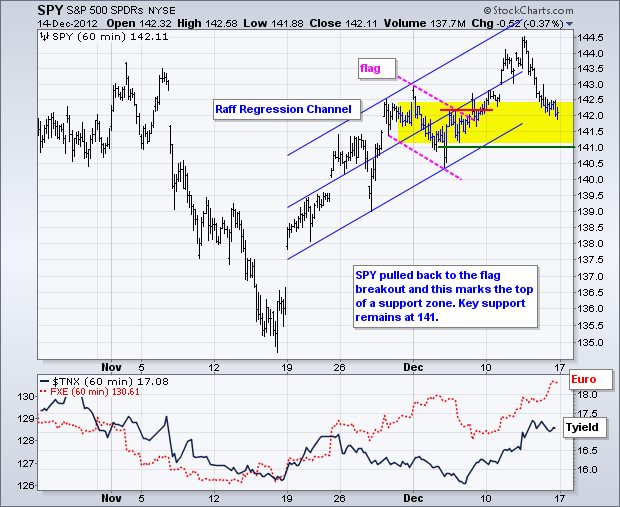
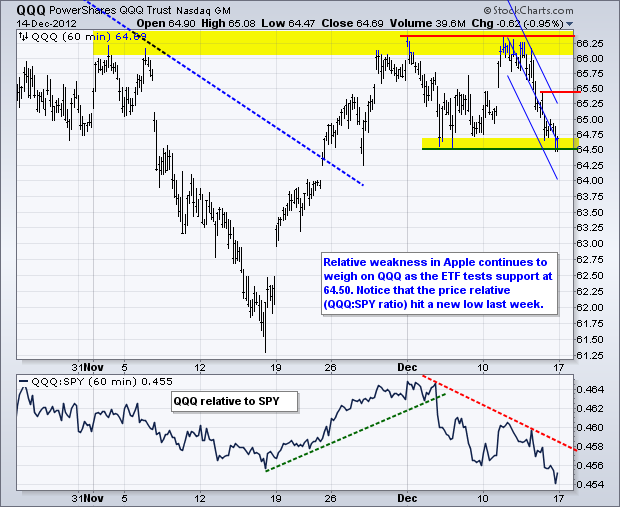
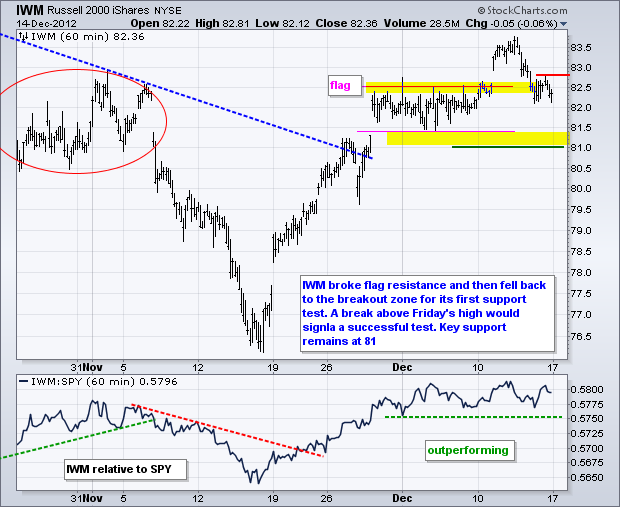
Trading could get real tricky (volatile) has we head into the fiscal-cliff endgame and holiday season. First, the markets will become extra sensitive to the news flow out of Washington over the next two weeks. Second, trading volume will thin, which means any uptick in volume could cause an outsized move. Sounds like a good time to move aside and return in January! The major index ETFs remain in short-term uptrends, but pulled back last week as the S&P 500 ETF (SPY) tests its support zone. QQQ continues to be weighed down by weakness in Apple, which was down around $20 on Friday. This is the same company that sold over 2 million iPhones in China over the weekend. Perhaps the law of large numbers is catching up with Apple. Apple still dominates the Nasdaq 100 ETF (QQQ) and Friday's breakdown is not good.

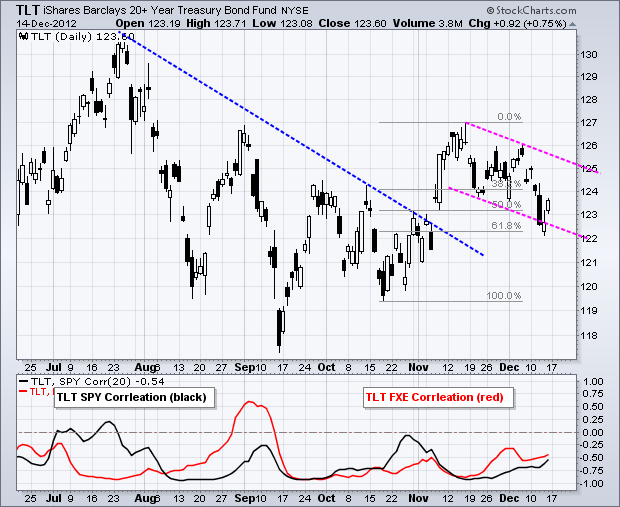
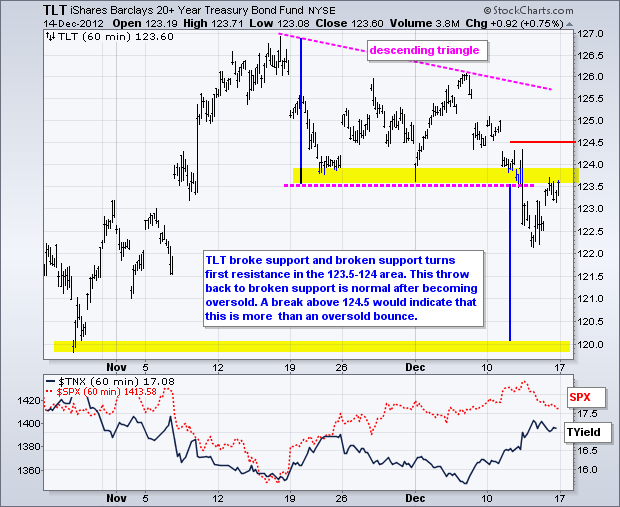
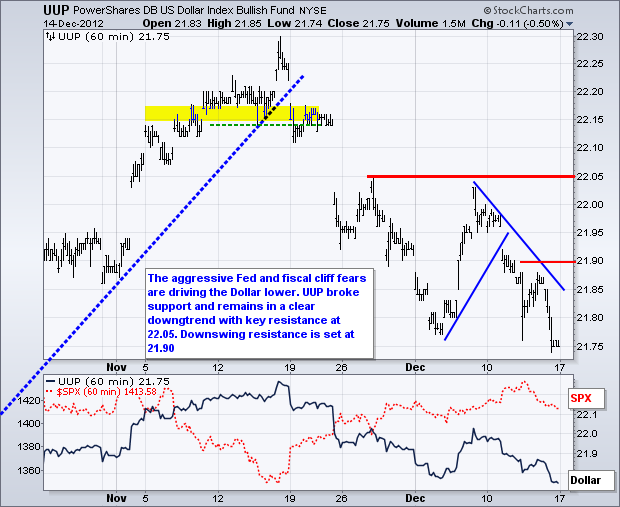
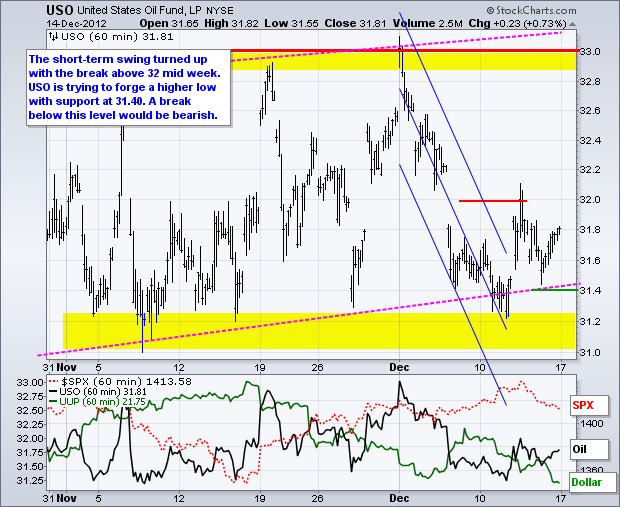
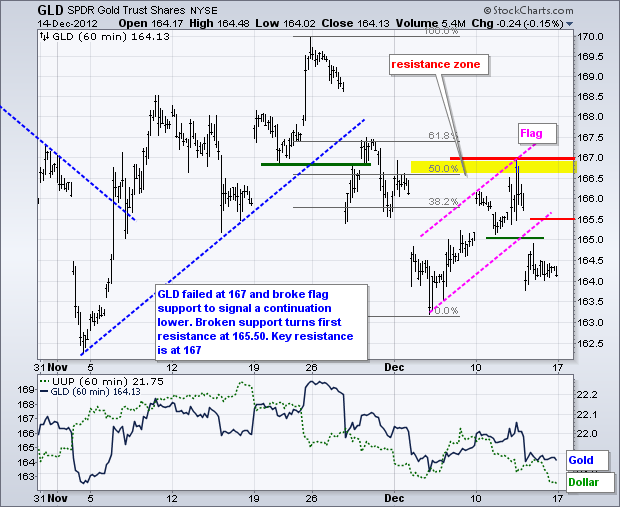
Elsewhere, the Dollar seems to be bearing the brunt of the fiscal cliff right now. The greenback fell sharply last week and is down in early trading on Monday. A rising Euro and falling Dollar is typically bullish for stocks, oil and gold. However, oil continues to flounder and gold broke down last week. Something is clearly rotten in the intermarket arena. The 20+ Year T-Bond ETF (TLT) also broke down last week as the Fed announced a new quantitative easing initiative. Despite this breakdown, notice that TLT bounced off the 61.80% retracement on Thursday-Friday and a falling flag may be taking shape on the daily chart. Follow through above 124.5 would provide the first sign that last week's breakdown was a bear trap.
**************************************************************************
**************************************************************************
**************************************************************************
**************************************************************************
**************************************************************************
Key Reports and Events:
Mon - Dec 17 - 08:30 - Empire State Manufacturing
Tue - Dec 18 - 10:00 - NAHB Housing Market Index
Wed - Dec 19 - 07:00 - MBA Mortgage Index
Wed - Dec 19 - 08:30 - Housing Starts & Building Permits
Wed - Dec 19 - 10:30 - Oil Inventories
Thu - Dec 20 - 08:30 - Jobless Claims
Thu - Dec 20 - 08:30 - GDP
Thu - Dec 20 - 10:00 - Existing Home Sales
Thu - Dec 20 - 10:00 - Philadelphia Fed Report
Thu - Dec 20 - 10:00 - Leading Economic Indicators
Fri - Dec 21 - 08:30 - Personal Income & Spending
Fri - Dec 21 - 08:30 - Durable Good Orders
Fri - Dec 21 - 09:55 - Michigan Sentiment
Charts of Interest: Tuesday and Thursday
This commentary and charts-of-interest are designed to stimulate thinking. This analysis is not a recommendation to buy, sell, hold or sell short any security (stock ETF or otherwise). We all need to think for ourselves when it comes to trading our own accounts. First, it is the only way to really learn. Second, we are the only ones responsible for our decisions. Think of these charts as food for further analysis. Before making a trade, it is important to have a plan. Plan the trade and trade the plan. Among other things, this includes setting a trigger level, a target area and a stop-loss level. It is also important to plan for three possible price movements: advance, decline or sideways. Have a plan for all three scenarios BEFORE making the trade. Consider possible holding times. And finally, look at overall market conditions and sector/industry performance.


**************************************************************************

**************************************************************************

**************************************************************************

**************************************************************************

**************************************************************************
Key Reports and Events:
Mon - Dec 17 - 08:30 - Empire State Manufacturing
Tue - Dec 18 - 10:00 - NAHB Housing Market Index
Wed - Dec 19 - 07:00 - MBA Mortgage Index
Wed - Dec 19 - 08:30 - Housing Starts & Building Permits
Wed - Dec 19 - 10:30 - Oil Inventories
Thu - Dec 20 - 08:30 - Jobless Claims
Thu - Dec 20 - 08:30 - GDP
Thu - Dec 20 - 10:00 - Existing Home Sales
Thu - Dec 20 - 10:00 - Philadelphia Fed Report
Thu - Dec 20 - 10:00 - Leading Economic Indicators
Fri - Dec 21 - 08:30 - Personal Income & Spending
Fri - Dec 21 - 08:30 - Durable Good Orders
Fri - Dec 21 - 09:55 - Michigan Sentiment
Charts of Interest: Tuesday and Thursday
This commentary and charts-of-interest are designed to stimulate thinking. This analysis is not a recommendation to buy, sell, hold or sell short any security (stock ETF or otherwise). We all need to think for ourselves when it comes to trading our own accounts. First, it is the only way to really learn. Second, we are the only ones responsible for our decisions. Think of these charts as food for further analysis. Before making a trade, it is important to have a plan. Plan the trade and trade the plan. Among other things, this includes setting a trigger level, a target area and a stop-loss level. It is also important to plan for three possible price movements: advance, decline or sideways. Have a plan for all three scenarios BEFORE making the trade. Consider possible holding times. And finally, look at overall market conditions and sector/industry performance.

About the author:
Arthur Hill, CMT, is the Chief Technical Strategist at TrendInvestorPro.com. Focusing predominantly on US equities and ETFs, his systematic approach of identifying trend, finding signals within the trend, and setting key price levels has made him an esteemed market technician. Arthur has written articles for numerous financial publications including Barrons and Stocks & Commodities Magazine. In addition to his Chartered Market Technician (CMT) designation, he holds an MBA from the Cass Business School at City University in London.
Learn More