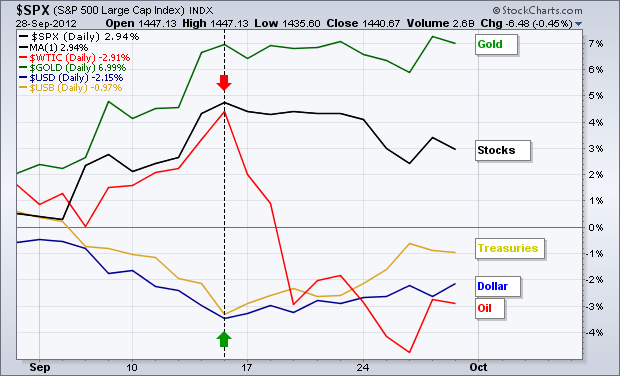
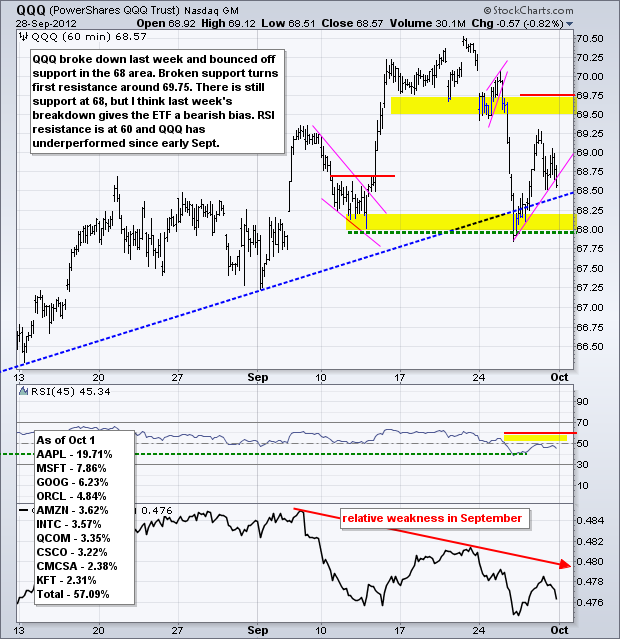
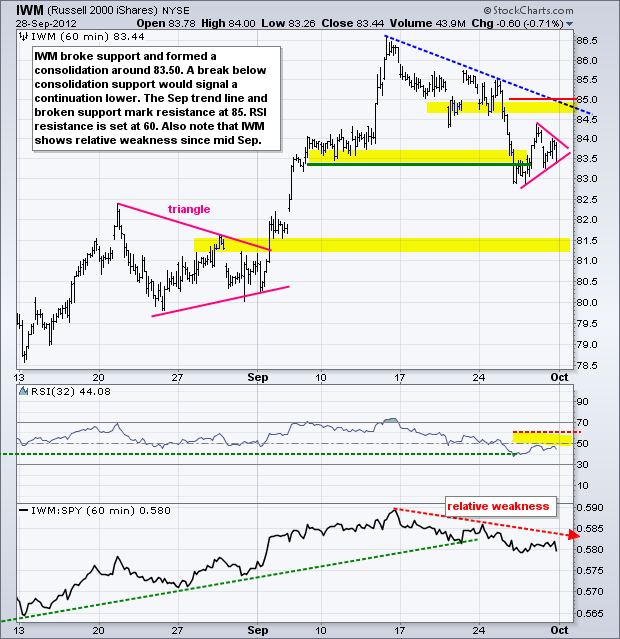
Strength in the Dollar and US Treasuries remains a negative for the stock market. Even though these uptrends are still relatively short, continued strength in the Dollar and Treasuries would weigh further on stocks. The chart below shows five intermarket securities with a black dotted line on 14-Sep. This date marks a short-term bottom in the US Dollar Index ($USD) and 30-Year US Treasury Bond ($USB). It also marks a peak in the S&P 500 and Spot Light Crude ($WTIC). Spot Gold ($GOLD) has a mind of its own right now and remains strong.
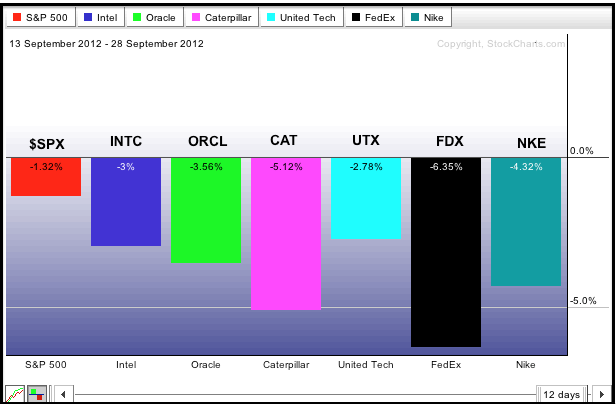
I showed this chart in Friday's Market Message and will show it again because the third quarter just ended. This means earnings season will begin soon. Preliminary reports have not been good and the S&P 500 remains at relatively high levels. This means disappointments would likely weigh on the stock market. This PerfChart shows six big companies that disappointed in September. The S&P 500 is down since September 13th and all six of these are down more, which means they are showing relative weakness. A few misses by a few small companies will be one thing. Several misses by several big companies is another.
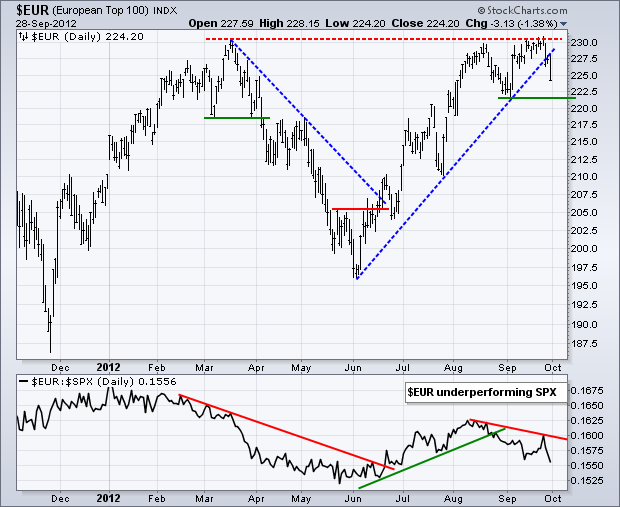
It is going to be a big week on the economic front. The week kicks off with the ISM Manufacturing Index on Monday and ends with the Employment report on Friday. In between, traders can look forward to Auto-Truck Sales, Fed minutes, ISM Services and Factory Orders. Attention may turn to Europe later this month with two big EU meetings scheduled on 8-9 October and 18-19 October. Talks will cover the usual suspects and issues. Forget about trying to interpret press reports and EU communiqués. Just watch EU bond yields, the Euro and the European stock indices for the real clues. The European Top 100 Index ($EUR) hit resistance from the March highs and turned down last week. The index is underperforming the S&P 500 and a break below support would be bearish.
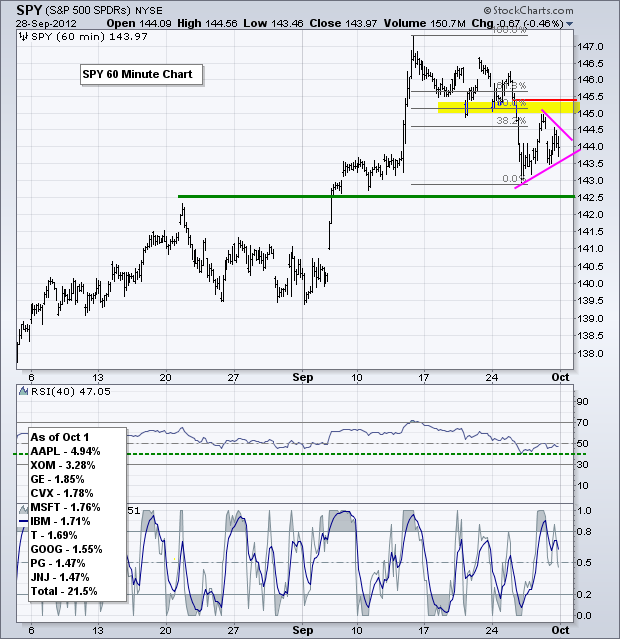
Turning to the good old US of A, the S&P 500 ETF (SPY) broke short-term support with a decline below 145 and consolidated with a pennant. A break below Friday's low would signal a continuation lower and project a support break at 142.50. Such a move would also push RSI below 40 and turn the short-term trend bearish. Broken support and Thursday's high mark the first resistance level to watch.
**************************************************************************
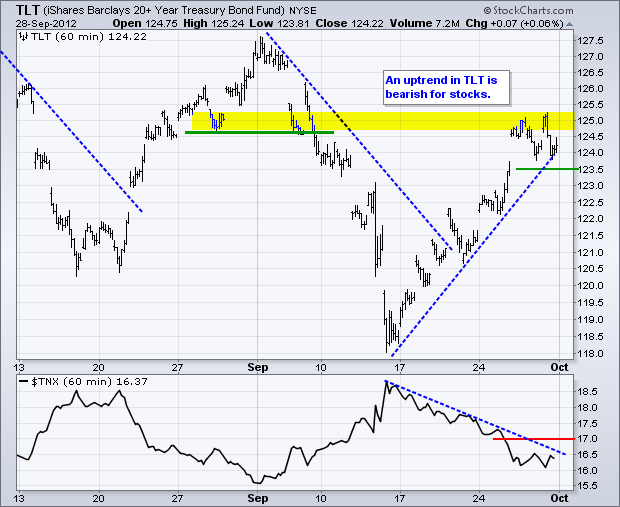
The 20+ Year T-Bond ETF (TLT) surged from 118 to 125 in the second half of September. It is possible that broken support turns into resistance here, but this rally looks rather strong for a mere oversold bounce. Uptrend support is set at 123.5 for TLT. Downtrend resistance is set at 1.7% for the 10-year Treasury Yield ($TNX). Both need breaks to reverse their trends. Continued strength in TLT would be bearish for stocks. It is a huge week for Treasuries because of the economic reports.
**************************************************************************
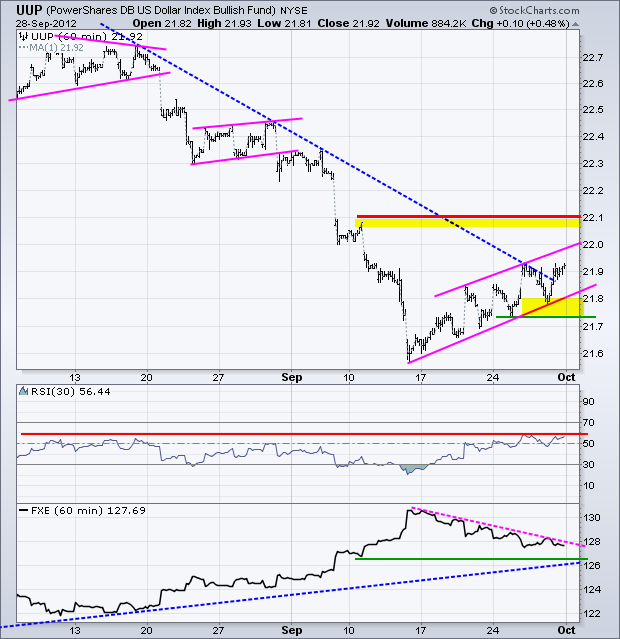
The US Dollar Fund (UUP) has been creeping higher since mid September. A rising channel has taken shape with a positive slope that defines the move. A break above the upper trend line would signal an acceleration higher and this could lead to a breakout at 22.10. Also notice that RSI is testing resistance at 60. A rising Dollar favors the risk-off trade, which is bearish for stocks and commodities. A break below 21.72 would reverse the two week uptrend.
**************************************************************************
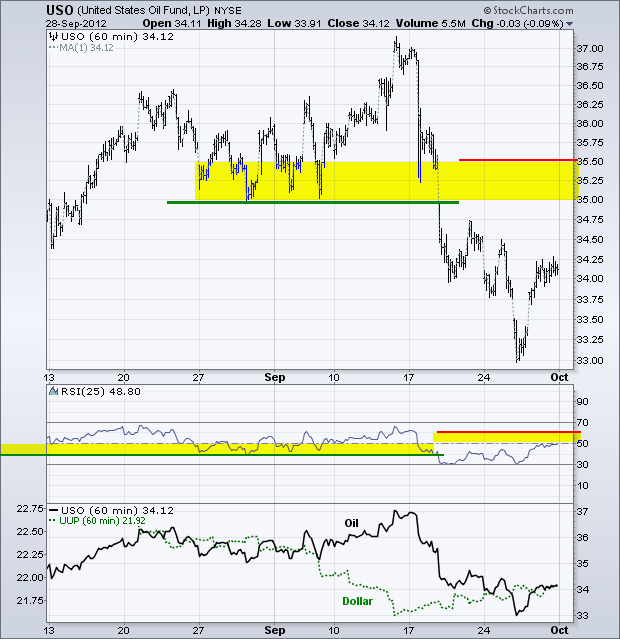
The US Oil Fund (USO) broke down last week. We can blame a firmer Dollar and weaker stock market, but oil moved disproportionately. USO got an oversold bounce late last week, but this is not enough to reverse the technical damage. Broken support turns first resistance in the 35-35.50 area. RSI resistance is set at 60.
**************************************************************************
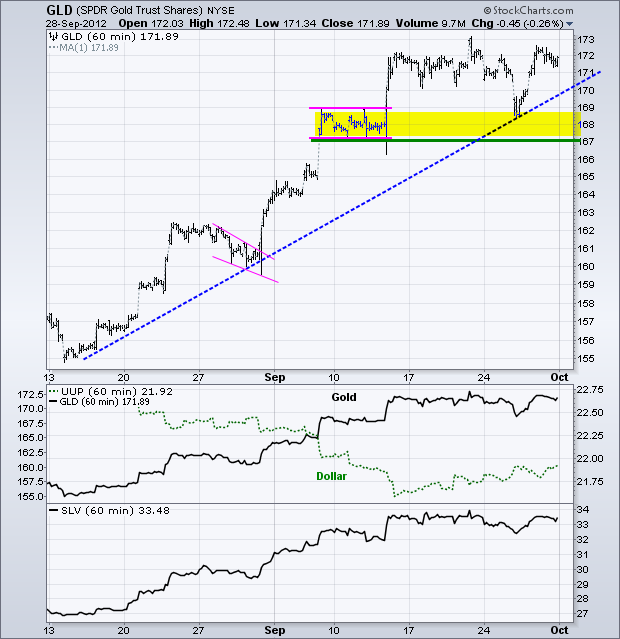
Even though the Dollar firmed and stocks softened, the Gold SPDR (GLD) held up quite well over the last two weeks. GLD plunged below 170, but quickly recovered and moved back near the top of its range. This recovery reinforces support in the 167-168 area. The trend is firmly bullish as long as this level holds. A break above 173 would signal another continuation higher for bullion. The QE debate from this week's Fed minutes release will likely affect gold.
**************************************************************************
Key Reports and Events:
Mon - Oct 01 - 10:00 - ISM Manufacturing Index
Mon - Oct 01 - 10:00 - Construction Spending
Tue - Oct 02 - 14:00 - Auto/Truck Sales
Wed - Oct 03 - 07:00 - MBA Mortgage Index
Wed - Oct 03 - 08:15 - ADP Employment Change
Wed - Oct 03 - 10:00 - ISM Services Index
Wed - Oct 03 - 10:30 - Oil Inventories
Wed - Oct 03 - 14:00 - FOMC Minutes
Wed - Oct 03 – 20:00 – Presidential Debate
Thu - Oct 04 - 07:30 - Challenger Job Cuts
Thu - Oct 04 - 08:30 - Jobless Claims
Thu - Oct 04 - 10:00 - Factory Orders
Fri - Oct 05 - 08:30 - Employment Report
Mon - Oct 08 - 09:00 – EU Finance Ministers Meet
Tue - Oct 09 - 09:00 - EU Finance Ministers Meet
Thu – Oct 18 – 09:00 – EU Summit
Fri – Oct 19 – 09:00 – EU Summit
Charts of Interest: Tuesday and Thursday
This commentary and charts-of-interest are designed to stimulate thinking. This analysis is not a recommendation to buy, sell, hold or sell short any security (stock ETF or otherwise). We all need to think for ourselves when it comes to trading our own accounts. First, it is the only way to really learn. Second, we are the only ones responsible for our decisions. Think of these charts as food for further analysis. Before making a trade, it is important to have a plan. Plan the trade and trade the plan. Among other things, this includes setting a trigger level, a target area and a stop-loss level. It is also important to plan for three possible price movements: advance, decline or sideways. Have a plan for all three scenarios BEFORE making the trade. Consider possible holding times. And finally, look at overall market conditions and sector/industry performance.

