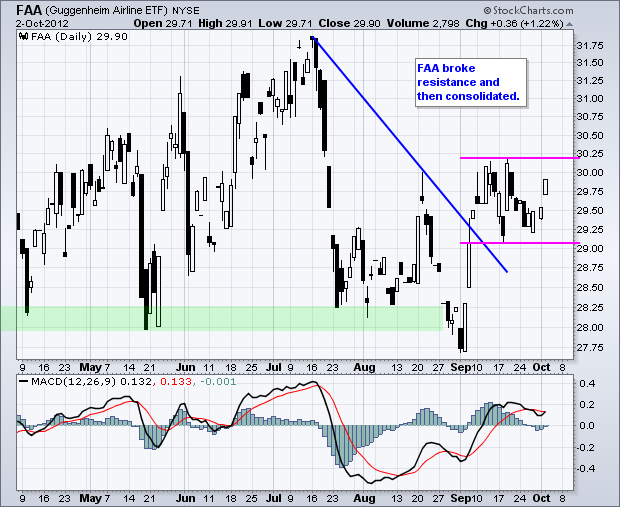
Strange, and indecisive days, continued as the Dow Industrials SPDR (DIA) edged lower and the S&P MidCap 400 SPDR (MDY) edged higher. Stocks were about as mixed as can be on Tuesday. Six of the nine sectors were up, but the biggest gain was just .52% from the Utilities SPDR (XLU). The biggest loss came from the Basic Materials SPDR (XLB), which declined .54% on the day. There was some action in airlines as the Airline ETF (FAA) came to life with a two day surge off consolidation support. MACD moved into positive territory earlier this month and turned up over the last two days as well. Within the group, DAL broke consolidation resistance and LUV bounced on good volume.

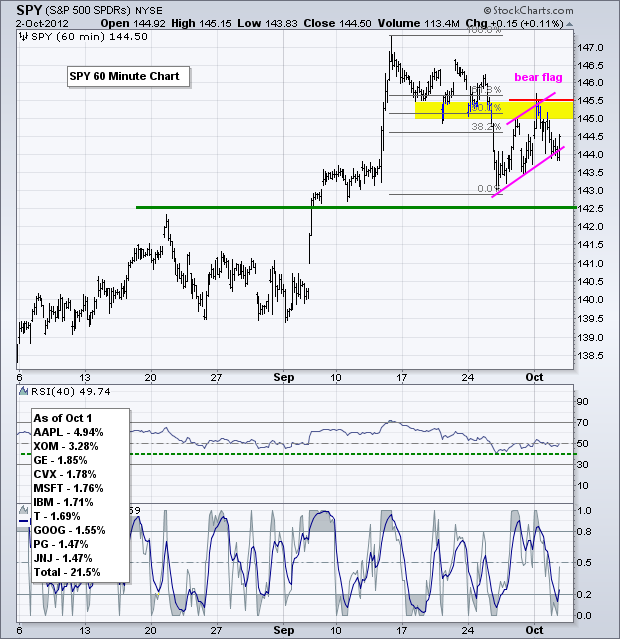
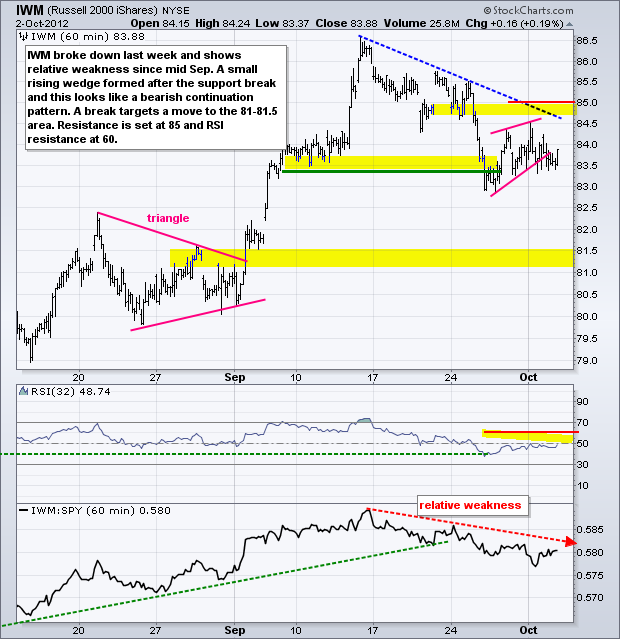
The S&P 500 ETF (SPY) broke down last week and then bounced back to broken support with a rising flag the last few days. Except for last week's decisive break below 145, trading has been quite choppy since 17-Sept and could remain choppy for a few more weeks. The rising flag is a bearish pattern and a break below flag support would signal a continuation lower. SPY appeared to break support Tuesday afternoon, but rallied in the final hour to close at 144.50. A move below yesterday's low would put the flag break back in play.
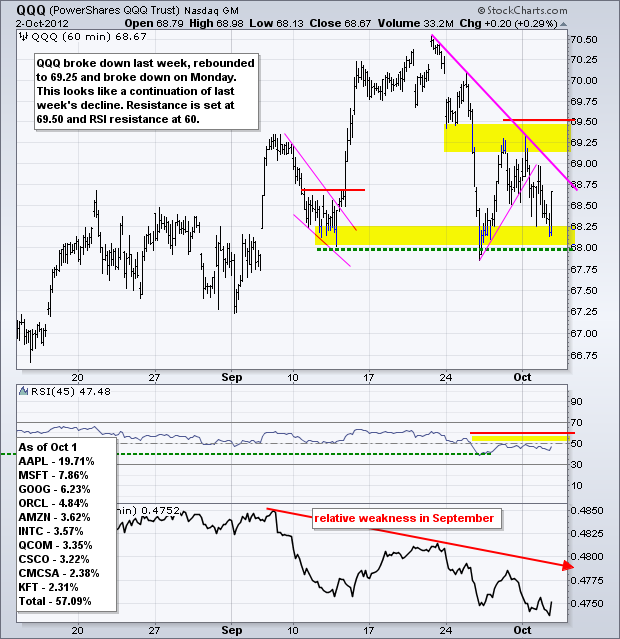
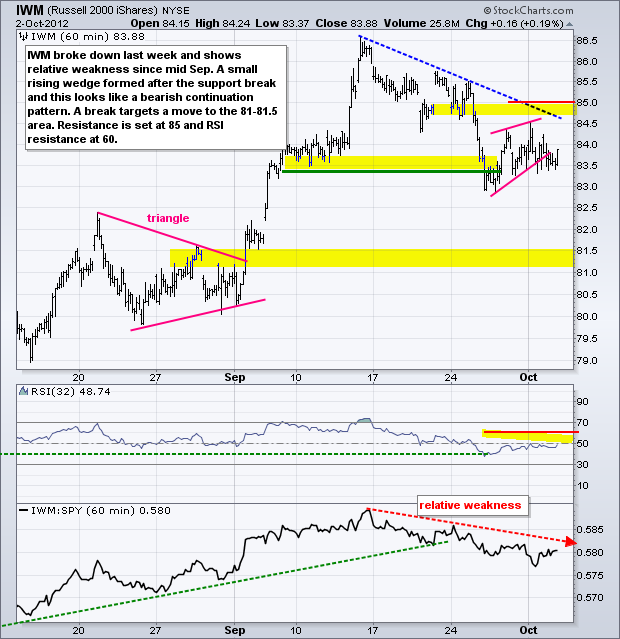
**************************************************************************
No change. The 20+ Year T-Bond Fund (TLT) surged and became overbought with the move above 124.50. The ETF consolidated the last few days to work off this overbought condition. A break above 125 would signal a continuation higher and be bearish for stocks. I am setting support just below the consolidation to allow for a buffer. A break below 123 would reverse the three week uptrend and be bullish for stocks. This is a big week for treasuries because of the key economic reports scheduled for release this week.
**************************************************************************
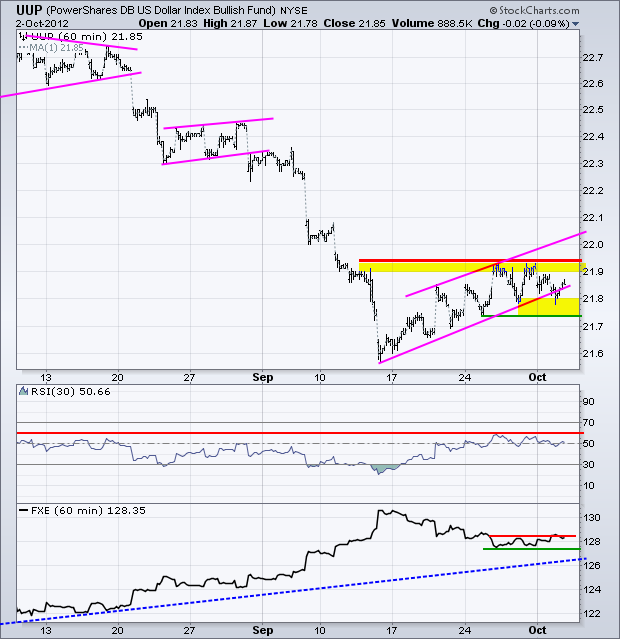
No change. The US Dollar Fund (UUP) remains within a rising channel and could be nearing its make of break point. A surge above the upper trend line would signal an acceleration higher. I am, however, setting key resistance a little lower at 21.95. Chartists should also watch RSI for a breakout at 60 to confirm. Channel support remains at 21.72 and a break below this level would signal a continuation of the bigger downtrend.
**************************************************************************
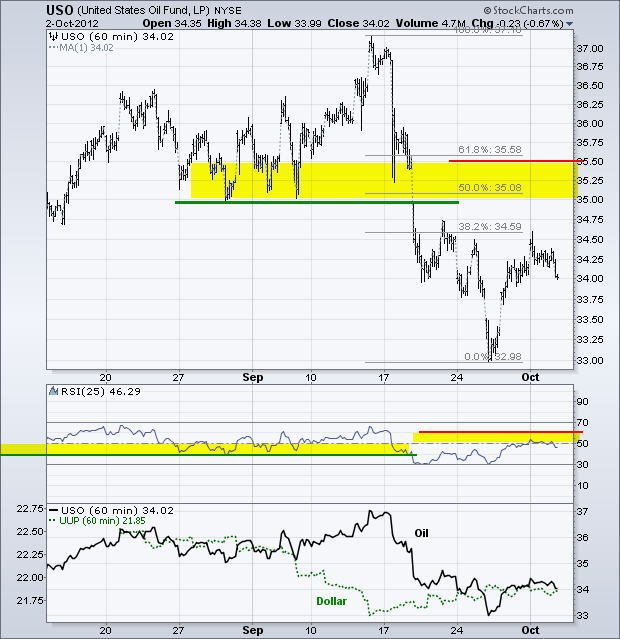
No change. The US Oil Fund (USO) broke down last week. We can blame a firmer Dollar and weaker stock market, but oil moved disproportionately. USO got an oversold bounce late last week, but this is not enough to reverse the technical damage. Broken support turns first resistance in the 35-35.50 area. RSI resistance is set at 60.
**************************************************************************
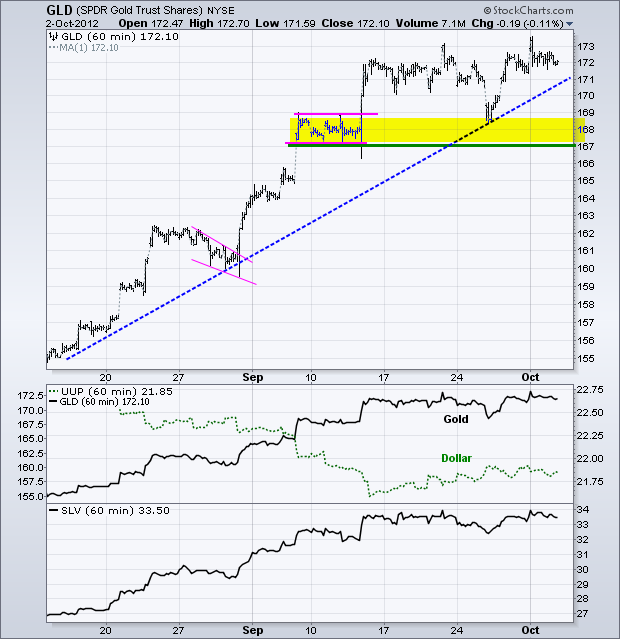
No change. Even though the Dollar firmed and stocks softened, the Gold SPDR (GLD) held up quite well over the last two weeks. GLD plunged below 170, but quickly recovered and moved back near the top of its range. This recovery reinforces support in the 167-168 area. The trend is firmly bullish as long as this level holds. A break above 173 would signal another continuation higher for bullion. The QE debate from this week's Fed minutes release will likely affect gold.
**************************************************************************
Key Reports and Events:
Tue - Oct 02 - 14:00 - Auto/Truck Sales
Wed - Oct 03 - 07:00 - MBA Mortgage Index
Wed - Oct 03 - 08:15 - ADP Employment Change
Wed - Oct 03 - 10:00 - ISM Services Index
Wed - Oct 03 - 10:30 - Oil Inventories
Wed - Oct 03 - 14:00 - FOMC Minutes
Wed - Oct 03 – 20:00 – Presidential Debate
Thu - Oct 04 - 07:30 - Challenger Job Cuts
Thu - Oct 04 - 08:30 - Jobless Claims
Thu - Oct 04 - 10:00 - Factory Orders
Fri - Oct 05 - 08:30 - Employment Report
Mon - Oct 08 - 09:00 – EU Finance Ministers Meet
Tue - Oct 09 - 09:00 - EU Finance Ministers Meet
Thu – Oct 18 – 09:00 – EU Summit
Fri – Oct 19 – 09:00 – EU Summit
Charts of Interest: Tuesday and Thursday
This commentary and charts-of-interest are designed to stimulate thinking. This analysis is not a recommendation to buy, sell, hold or sell short any security (stock ETF or otherwise). We all need to think for ourselves when it comes to trading our own accounts. First, it is the only way to really learn. Second, we are the only ones responsible for our decisions. Think of these charts as food for further analysis. Before making a trade, it is important to have a plan. Plan the trade and trade the plan. Among other things, this includes setting a trigger level, a target area and a stop-loss level. It is also important to plan for three possible price movements: advance, decline or sideways. Have a plan for all three scenarios BEFORE making the trade. Consider possible holding times. And finally, look at overall market conditions and sector/industry performance.

About the author:
Arthur Hill, CMT, is the Chief Technical Strategist at TrendInvestorPro.com. Focusing predominantly on US equities and ETFs, his systematic approach of identifying trend, finding signals within the trend, and setting key price levels has made him an esteemed market technician. Arthur has written articles for numerous financial publications including Barrons and Stocks & Commodities Magazine. In addition to his Chartered Market Technician (CMT) designation, he holds an MBA from the Cass Business School at City University in London.
Learn More