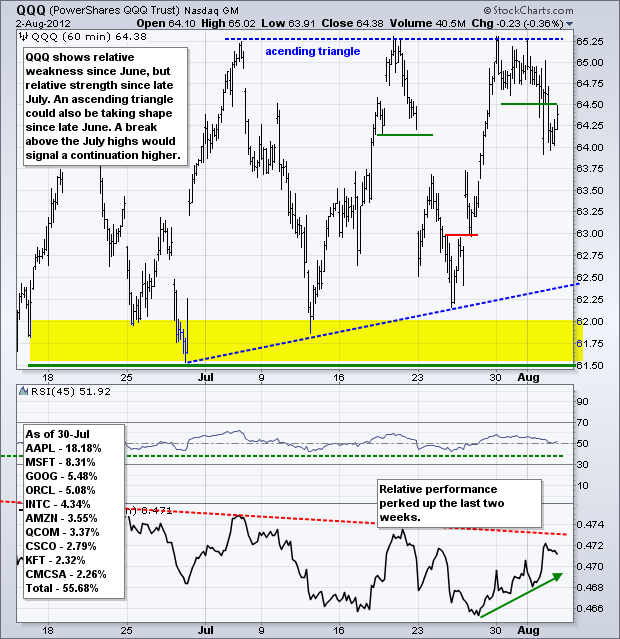
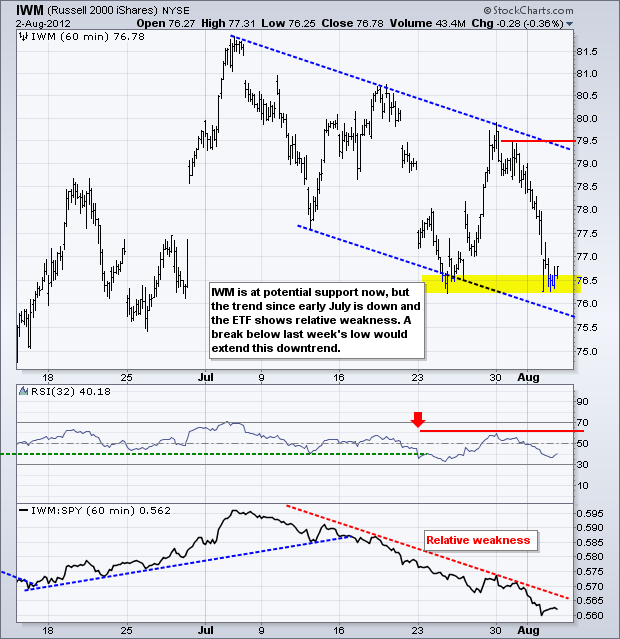
Stocks moved sharply lower on Thursday's open when it became clear that European Central Bank (ECB) president Mario Draghi was not quite ready to act. Nevertheless, stocks firmed at midday and then edged off their lows in the afternoon. Perhaps the market is expecting an upside surprise to today's employment report. Truth be told, I have no idea how today's report will pan out. Participants are expecting 95,000 new jobs to be added for July. Anything north of 125,000 would be enough of a beat to possibly buoy the stock market and hit the bond market. Anything less than 90,000 would be a disappointment. While another weak number would increase the chances of quantitative easing, it is unclear when or even if the Fed will act. Keep in mind that a recession is very unlikely as long as job growth remains positive, even if it is sluggish.
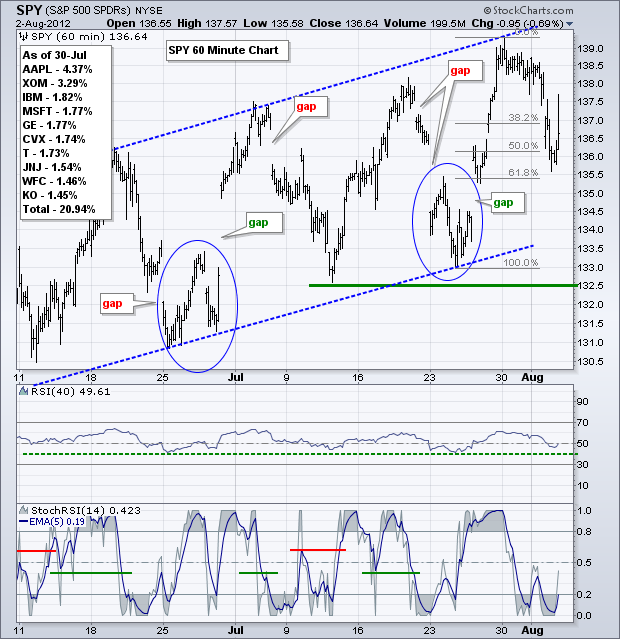
On the 60-minute chart, the S&P 500 ETF (SPY) continues to zigzag higher with a series of rising peaks and rising troughs since June. Playing the moves within this channel has been difficult because the ETF tends to gap up when forming a higher trough and gap down when forming a lower peak. With the decline below 136 on Wednesday, the ETF is near the 61.80% retracement line and just above last week's gap up. Keep in mind that comments from Mario Draghi produced this gap. This means SPY is at a short-term moment-of-truth. Should the ETF hold the 135.50 level and break above 138 today, we may see an acceleration higher and a late summer rally. A break below 135.50 would target a move to the support zone around 132.5-133.
**************************************************************************
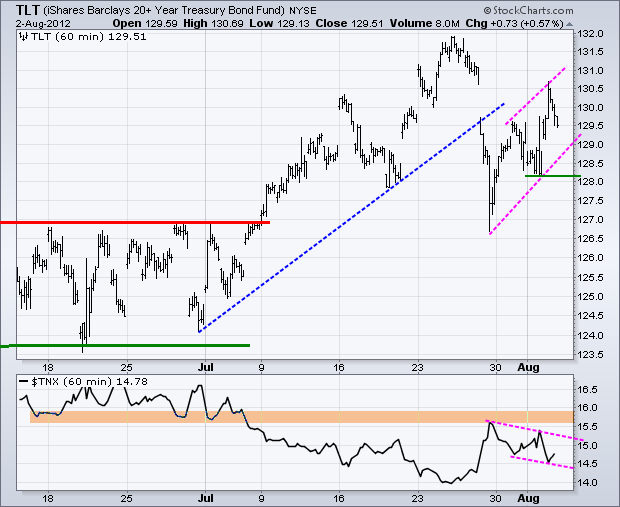
Today is a big day for the treasury market. The medium-term and long-term trends are up. With a bounce the last 4-5 days, the short-term trend is also up as a rising channel takes shape. These uptrends are bearish for stocks. Resistance could be at hand from last week's plunge as TLT pulled back from its high in afternoon trading on Wednesday. Follow through with a support break at 128 would signal a continuation lower. A breakout at 15.50 in the 10-year Treasury Yield ($TNX) would confirm. Such moves would be bullish for stocks.
**************************************************************************
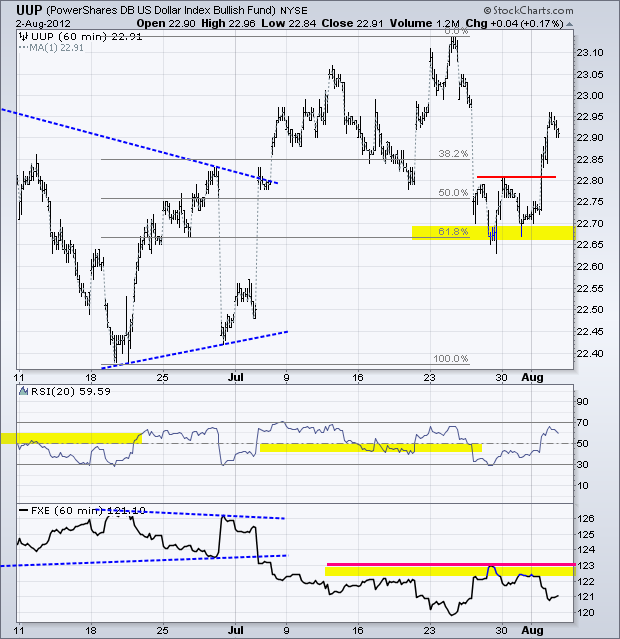
No change. The Fed did not offer any new stimulus and Draghi fell short on action. The Fed events strengthened the Dollar and the ECB events weakened the Euro. The US Dollar Fund (UUP) held the 61.80% retracement and broke above short-term resistance with a surge on Wednesday. The Euro Currency Trust (FXE) also failed at resistance (123).
**************************************************************************
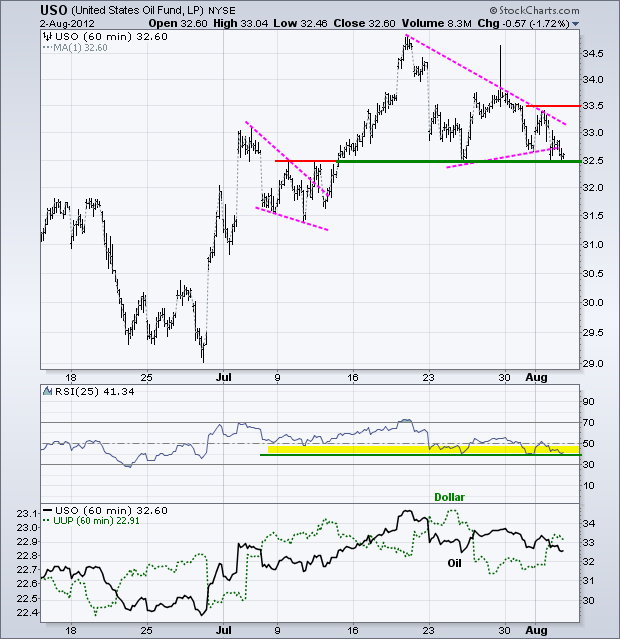
The US Oil Fund (USO) edged below the lower trend line of the triangle, but held support at 32.50 for now. RSI is also testing support near 40. A break below both levels would be short-term bearish. Should USO hold, look for a break above 33.50 to signal a continuation of the July advance.
**************************************************************************
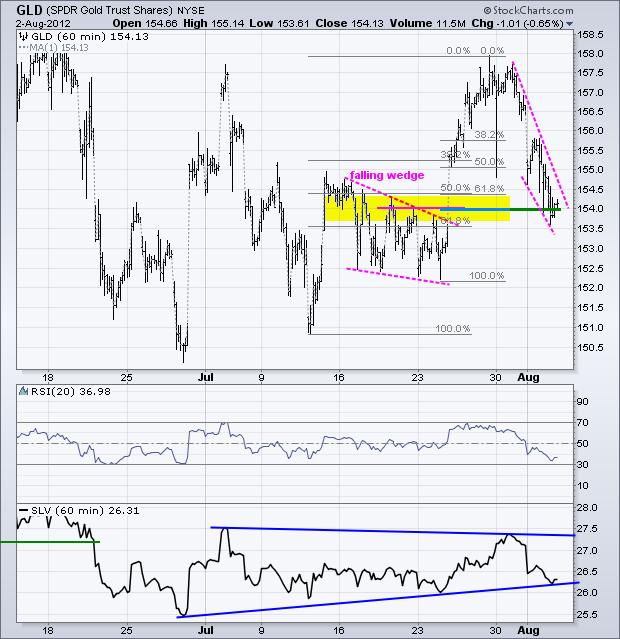
Gold acts like a risk-on asset and clearly wants to see more quantitative easing. After a let down Wednesday, the Gold SPDR (GLD) fell back to broken resistance around 154. This area turns into a potential support zone. Also notice the Fibonacci cluster in this area. The Fibonacci Retracements extend from the mid July low and the early July low. This could be a moment-of-truth for bullion. A surge above 155 would keep support and the falling wedge breakout alive. Further weakness would surely negate this breakout and keep the long-term downtrend dominant.
**************************************************************************
Key Reports and Events:
Fri - Aug 03 - 10:00 - ISM Services Index
Fri – Aug 03 - 08:30 – Employment Report
Fri – Aug 31 – 09:00 – Jackson Hole Central Bank Symposium
Charts of Interest: Tuesday and Thursday
This commentary and charts-of-interest are designed to stimulate thinking. This analysis is not a recommendation to buy, sell, hold or sell short any security (stock ETF or otherwise). We all need to think for ourselves when it comes to trading our own accounts. First, it is the only way to really learn. Second, we are the only ones responsible for our decisions. Think of these charts as food for further analysis. Before making a trade, it is important to have a plan. Plan the trade and trade the plan. Among other things, this includes setting a trigger level, a target area and a stop-loss level. It is also important to plan for three possible price movements: advance, decline or sideways. Have a plan for all three scenarios BEFORE making the trade. Consider possible holding times. And finally, look at overall market conditions and sector/industry performance.

