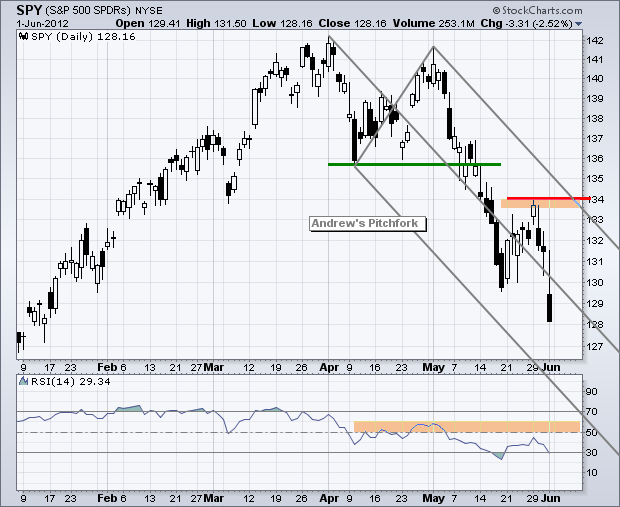
Friday produced yet another round of economic reports that were below expectations and the stock market moved sharply lower. Even though EU issues may be lurking behind the scenes, don't forget that US economic reports have been falling short for two months now. While the employment numbers were not outright negative, non-farm payrolls increased about half of what was expected (69,000 actual versus 150000 expected). US stocks were priced for strong growth in early April and early May when SPY was trading above 140 and at 52-week highs. After pricing in reduced expectations, SPY is now trading below 129 and is down around 10% from its spring highs. On the chart below, it is possible to draw Andrew's Pitchfork and mark key resistance at 134. RSI resistance is set in the 50-60 zone.

In contrast to the other eight sector SPDRs, XLU is still trading near a 52-week high and showing some serious relative weakness. Also notice that the ETF is forming a bullish cup-with-handle pattern. The search for yield has pushed investors into dividend rich utilities, which certainly offer more bang for your buck than US treasuries. XLU will continue to benefit as long as the 10-year Treasury Yield ($TNX) moves towards, gasp, 1%.

On the 60-minute chart, the S&P 500 ETF (SPY) broke rising flag support with a sharp decline and this support break turns into first resistance around 131. After a 4% decline in six days, the ETF is already getting short-term oversold. Nevertheless, any strength would be deemed an oversold bounce within bigger downtrends. The flag high at 134 marks key resistance for now.


**************************************************************************
The 20+ Year T-Bond ETF (TLT) surged above 130 and closed at a 52-week high. It is simply a runaway train right now as treasuries benefit from a perfect storm. EU problems are pushing money into relative safe-havens and the two month run of worse-than-expected economic reports means more easing on the horizon. On the price chart, broken resistance remains first support in the 124 area and key support is set around 122.

**************************************************************************
The US Dollar Fund (UUP) is up 5% in five weeks and still in a strong uptrend. Buyers are likely to avoid Euros until the Greek elections on 17-June and possibly until the EU summit at the end of June. Regardless of the upcoming events, the fate of the Euro rests with Germany and Angela Merkel. Remember the golden rule? She who has the gold (money) makes the rules. On the price chart, UUP is trading well above first support in the 22.70 area. Key support remains at 22.40 for now.

**************************************************************************
Oil continues to be hammered by a rising Dollar, falling stock market and surging treasury market. A strong Dollar is generally negative for commodities because many are priced in Dollars. A falling stock market points to a slowing economy and weakening demand for energy products. The surge in treasuries points to disinflation or perhaps even deflation. Even so, USO is quite oversold and trading at the lower trendline of a falling channel. This may give way to an oversold bounce, but not a lasting bottom.

**************************************************************************
The Gold SPDR (GLD) caught a big bid and broke above resistance from the mid May highs. This breakout reinforces support and should be considered bullish as long as it holds. A move back below 153 would negate this breakout and call for a reassessment. RSI broke above 60 for the first time since late February. This means RSI confirmed the breakout in GLD and momentum is bullish. The 50-60 zone acts as RSI resistance in a downtrend and I set RSI at 40-period because this setting conforms with the downtrend in GLD. In other words, 40-period RSI did not break above resistance at 60 in late March, early April, mid April, late April and mid May (blue arrows). Friday's move above 60 is RSI bullish.

**************************************************************************
Key Economic Reports:
Mon - Jun 04 - 10:00 - Factory Orders
Tue - Jun 05 - 10:00 - ISM Services
Wed - Jun 06 - 07:00 - MBA Mortgage Index
Wed - Jun 06 - 10:30 - Oil Inventories
Wed - Jun 06 - 14:00 - Fed Beige Book
Thu - Jun 07 - 08:30 - Jobless Claims
Sun - Jun 04 - 10:00 – Greek Holiday
Sun - Jun 17 - 10:00 – Greek Elections
Sun - Jun 28 - 10:00 – 2-day EU Summit
Charts of Interest: Tuesday and Thursday
This commentary and charts-of-interest are designed to stimulate thinking. This analysis is not a recommendation to buy, sell, hold or sell short any security (stock ETF or otherwise). We all need to think for ourselves when it comes to trading our own accounts. First, it is the only way to really learn. Second, we are the only ones responsible for our decisions. Think of these charts as food for further analysis. Before making a trade, it is important to have a plan. Plan the trade and trade the plan. Among other things, this includes setting a trigger level, a target area and a stop-loss level. It is also important to plan for three possible price movements: advance, decline or sideways. Have a plan for all three scenarios BEFORE making the trade. Consider possible holding times. And finally, look at overall market conditions and sector/industry performance.

