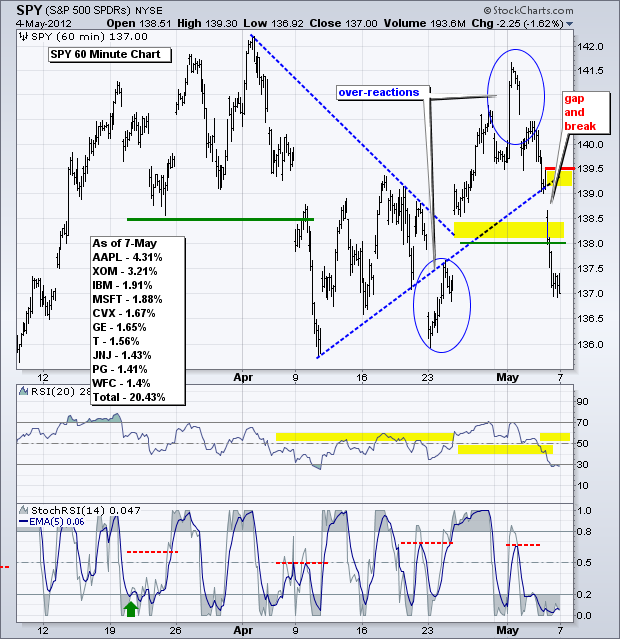
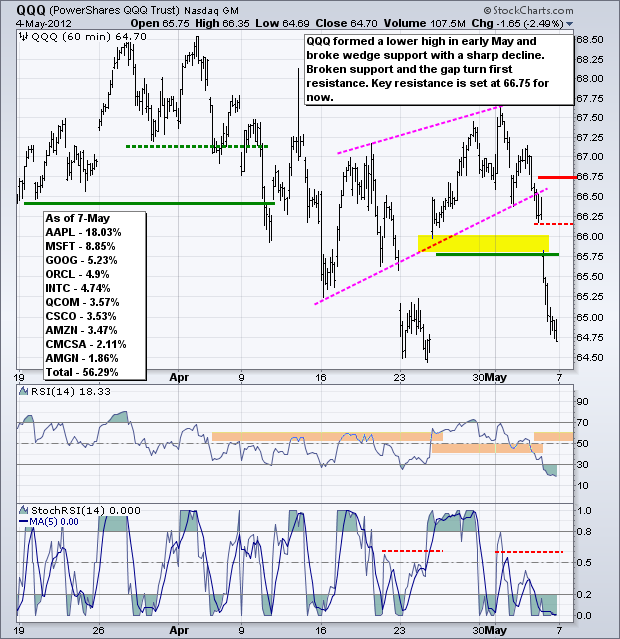
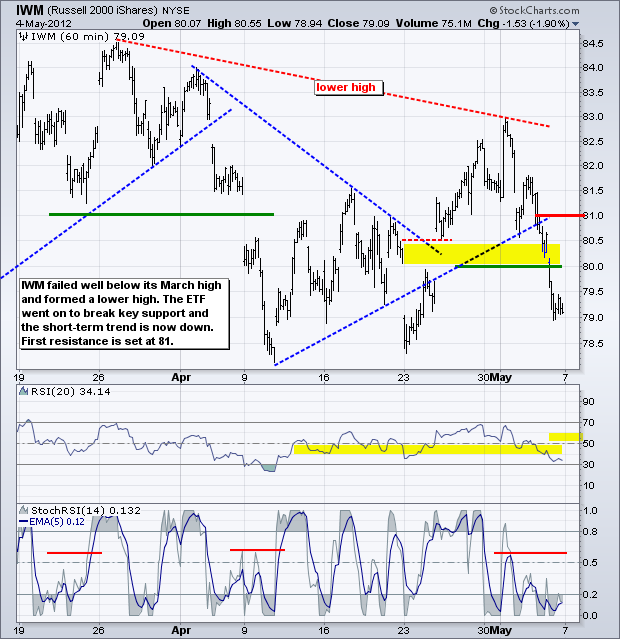
Uncertainty ratcheted up a notch in Europe as Hollande won the French election and the ruling coalition in Greece was dealt a setback. Asian stocks are down sharply, European stocks are down and Dow futures are down around 100 points. Oil, gold and the Euro are also down, while the Dollar and treasuries are up. It is a classic risk-off trade. On the S&P 500 ETF (SPY) chart, the ETF formed a lower high last week and broke below support with a gap-decline on Friday. The short-term trend is clearly down as the gap held and RSI broke below 40. Also notice that 20-period RSI moved from above 70 to below 30 in four days. This confirms the sudden swing from strength to weakness. The blue ovals on the price chart show two over-reactions. SPY gapped down below 137 at the end of April, but quickly reversed and moved higher. A few days later, SPY surged above 141, but quickly peaked and reversed lower. Forget what the CBOE Volatility Index ($VIX) says. Volatility is high and traders need a rather strong stomach for these swings. At this point, I am going to set resistance at 139.50 for SPY. A moved above this level would clearly negate last week's breakdown. RSI resistance remains at 60 and I will keep RSI at 20 periods for now.
**************************************************************************
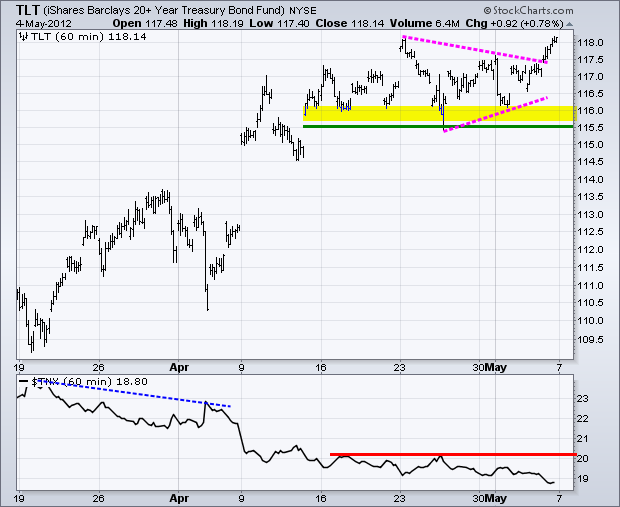
The 20+ Year T-Bond ETF (TLT) also made a big statement on Friday with a triangle breakout to signal a continuation of the uptrend. A breakout in treasuries is negative for stocks and favors the risk-off trade. Key support remains in the 115.5-116 area.
**************************************************************************
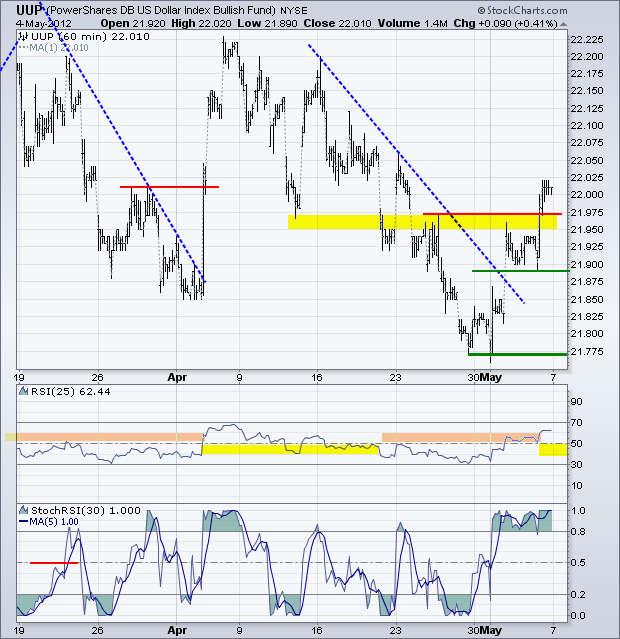
The US Dollar Fund (UUP) broke trendline resistance mid week and then broke above key resistance with a surge on Friday. The mid week consolidation marks the first support zone in the 21.90-21.975 area. RSI support is set at 40. I think the long-term trend for UUP is up (since August) and last week's short-term reversal is setting up for a continuation of the prior surge (from late August to early January). This could propel UUP to the 23 area. While not a big move in percentage terms, it could affect gold and other commodities.
**************************************************************************
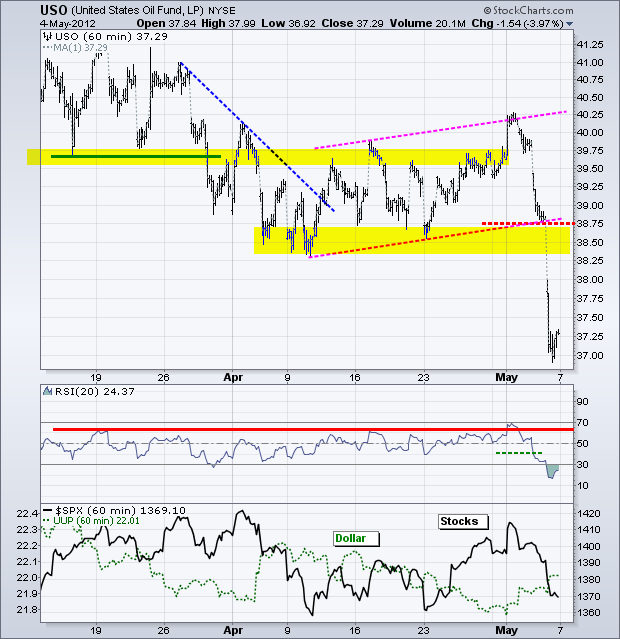
The US Oil Fund (USO) broke support in the 39.75 area, consolidated with a rising wedge and then broke down on Thursday. The ETF continued sharply lower on Friday and is now quite oversold. Nevertheless, weakness in global equities and strength in the Dollar will continue to weigh on oil. The December low marks the next support level around 36. Broken supports in the 38.5-38.75 area turn into first resistance.
**************************************************************************
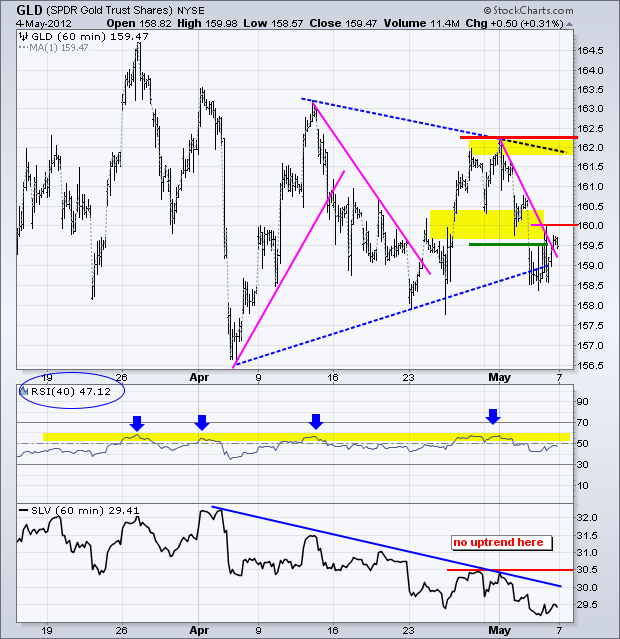
Considering the surge in the Dollar and plunge in stocks, the Gold SPDR (GLD) held up rather well on Friday and did not break the late April low. Despite a little relative strength, the seven week trend is flat (at best) as the ETF oscillates around the 160 level. Also notice that 40-period RSI remains below a well-defined resistance zone and momentum is bearish overall. Even so, nimble traders may want to focus on the swings within this range. The current swing is down with first resistance at 160.
**************************************************************************
Key Economic Reports:
Wed - May 09 07:00 - MBA Mortgage Index
Wed - May 09 10:30 - Oil Inventories
Thu - May 10 08:30 - Jobless Claims
Fri - May 11 08:30 – Producer Price Index (PPI)
Fri - May 11 09:55 - Michigan Sentiment
Charts of Interest: Tuesday and Thursday in separate post.
This commentary and charts-of-interest are designed to stimulate thinking. This analysis is not a recommendation to buy, sell, hold or sell short any security (stock ETF or otherwise). We all need to think for ourselves when it comes to trading our own accounts. First, it is the only way to really learn. Second, we are the only ones responsible for our decisions. Think of these charts as food for further analysis. Before making a trade, it is important to have a plan. Plan the trade and trade the plan. Among other things, this includes setting a trigger level, a target area and a stop-loss level. It is also important to plan for three possible price movements: advance, decline or sideways. Have a plan for all three scenarios BEFORE making the trade. Consider possible holding times. And finally, look at overall market conditions and sector/industry performance.

