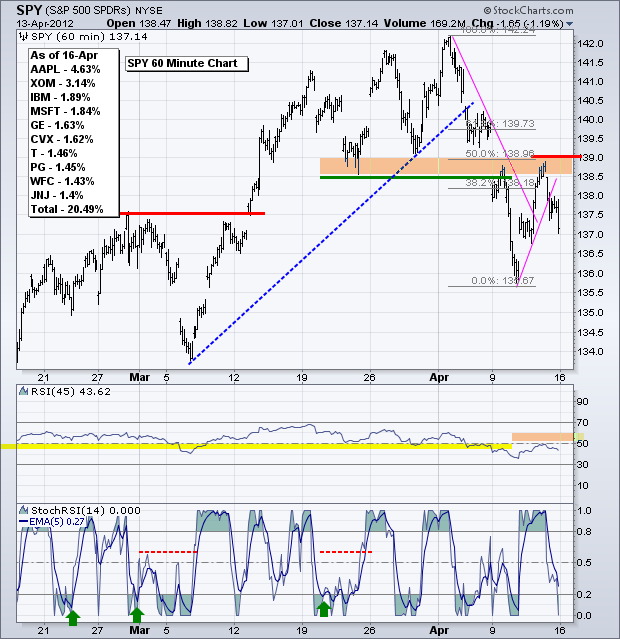
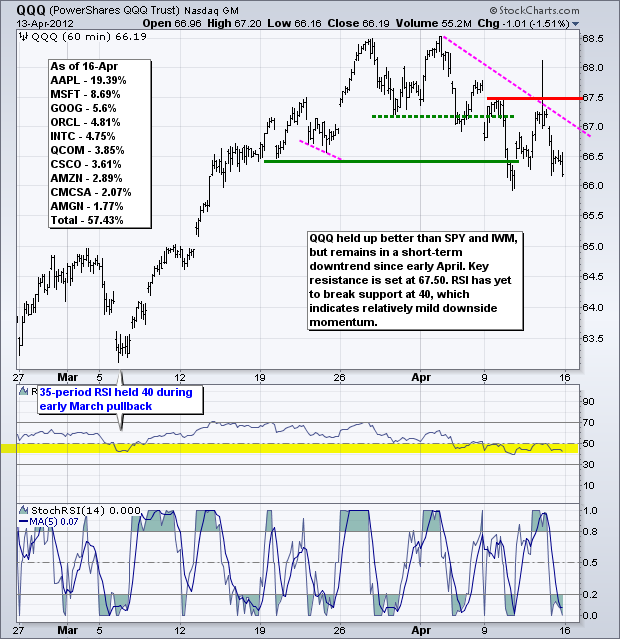
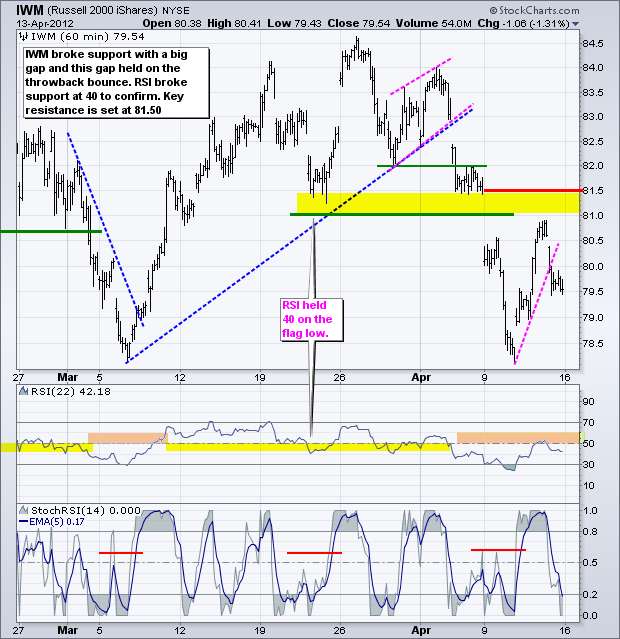
There were some trend changes over the last two weeks and some trend extensions. Most notably, stocks reversed their uptrends and the Dollar reversed its downtrend. While the bigger trend remains up for stocks, April's small-cap led decline started a short-term downtrend with key support breaks last week. Treasuries reversed their downtrend as money moved back to risk-off mode. Oil and gold extended their downtrends. On the SPY chart, the ETF broke support at 138.5 and this broken support zone turned into resistance in the 138.5-139 area. Notice that this throwback to broken support also retraced 50% of the prior decline. With a move back below 138 on Friday, SPY reversed the small upswing and reinforced resistance at 139.
**************************************************************************
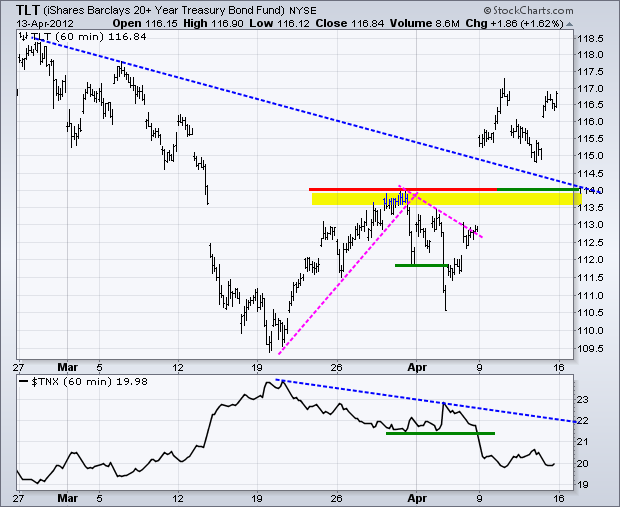
Volatility invaded the Treasury market as the 20+ Year T-Bond ETF (TLT) fell over 6% in the first part of March and then surged over 6% the last 3-4 weeks. The prior decline in treasuries was positive for stocks, but the new short-term uptrend is bearish for stocks and the economy. Treasuries are also benefitting from renewed weakness in the Euro and the flight-to-safety trade. TLT broke resistance at 114 last Monday and I am marking support at this breakout.
**************************************************************************
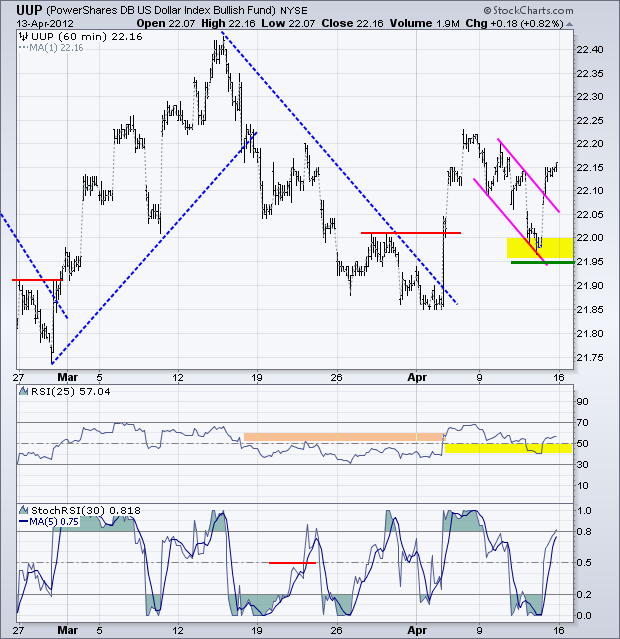
The US Dollar Fund (UUP) reversed its downtrend with a surge above 22 the first week of April. After a rather sharp pullback last week, the advance continued with a flag breakout at 22.10 on Friday. The flag low at 21.95 now becomes key support. RSI broke above 60 to confirm the breakout in early April. I reset RSI to 25 after this breakout to insure that 40 held during last week's flag pullback. The Euro will remain in the spotlight this week as Spanish bond yields rise and the first round of the French election nears (22-Apr). With just a week to go, Sarkozy is trailing his socialist opponent (Hollande) in the polls.
**************************************************************************
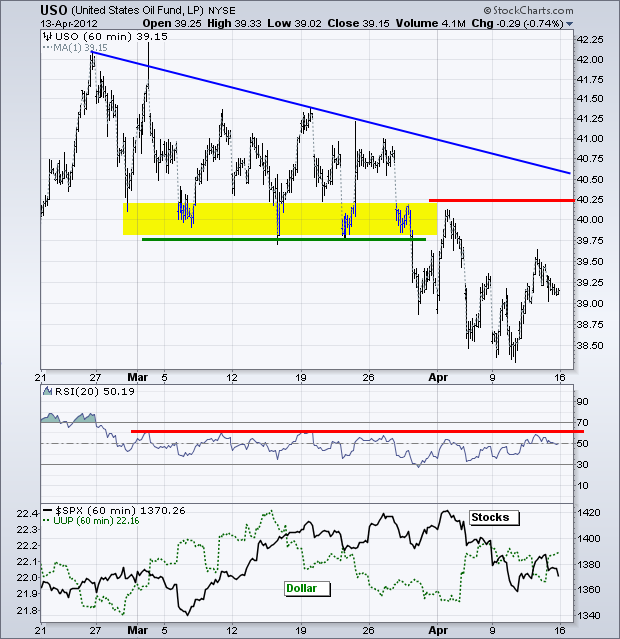
The US Oil Fund (USO) has been zigzagging lower since last February. Most notably, oil did not rally even though stocks were strong throughout March and the Dollar was weak in the second half of March. USO broke support in the 39.75-40 area at the end of March and this area turns into resistance. I am marking key resistance at 40.25 for now.
**************************************************************************
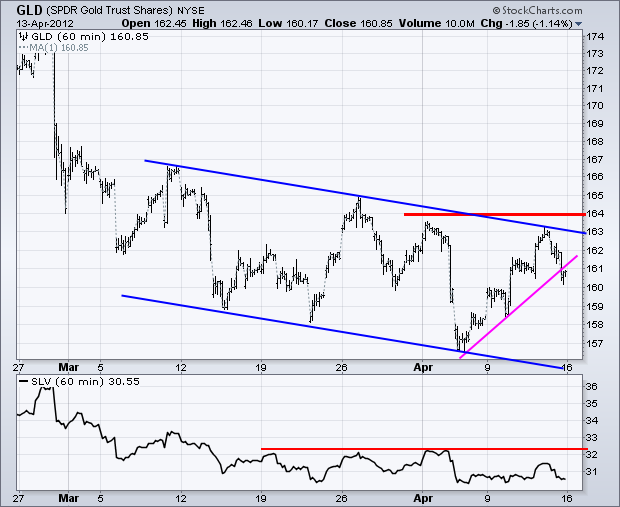
The Gold SPDR (GLD) had some good pops the last few weeks, but each pop ultimately formed a lower high and the downtrend continued. GLD broke down in late February with a sharp decline and has since been zigzagging lower. The bounce back to 163 last week marks the latest upswing, which was broken with the decline below 161 on Friday. The 163-164 zone marks key resistance. A break above this level is needed to reverse the string of lower highs.
**************************************************************************
Key Economic Reports:
Mon - Apr 16 - 08:30 - Retail Sales
Mon - Apr 16 - 08:30 - Empire Manufacturing
Mon - Apr 16 - 10:00 - Business Inventories
Mon - Apr 16 - 10:00 - NAHB Housing Market Index
Tue - Apr 17 - 08:30 - Housing Starts/Building Permits
Tue - Apr 17 - 09:15 - Industrial Production
Wed - Apr 18 - 07:00 - MBA Mortgage Index
Wed - Apr 18 - 10:30 - Crude Inventories
Thu - Apr 19 - 08:30 - Initial Claims
Thu - Apr 19 - 10:00 - Existing Home Sales
Thu - Apr 19 - 10:00 - Philadelphia Fed
Thu - Apr 19 - 10:00 - Leading Indicators
Charts of Interest: Tuesday and Thursday in separate post.
This commentary and charts-of-interest are designed to stimulate thinking. This analysis is not a recommendation to buy, sell, hold or sell short any security (stock ETF or otherwise). We all need to think for ourselves when it comes to trading our own accounts. First, it is the only way to really learn. Second, we are the only ones responsible for our decisions. Think of these charts as food for further analysis. Before making a trade, it is important to have a plan. Plan the trade and trade the plan. Among other things, this includes setting a trigger level, a target area and a stop-loss level. It is also important to plan for three possible price movements: advance, decline or sideways. Have a plan for all three scenarios BEFORE making the trade. Consider possible holding times. And finally, look at overall market conditions and sector/industry performance.

