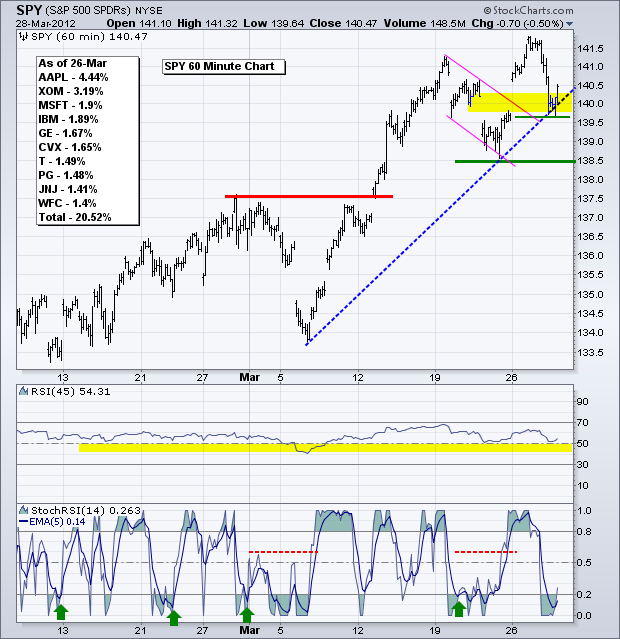
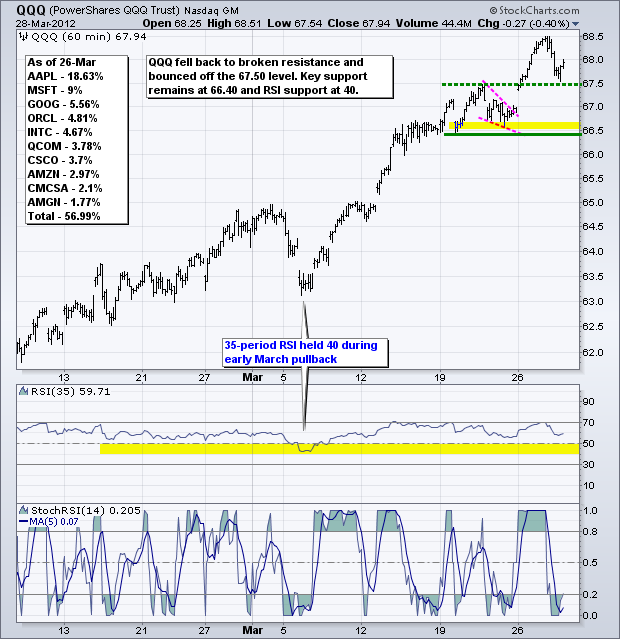
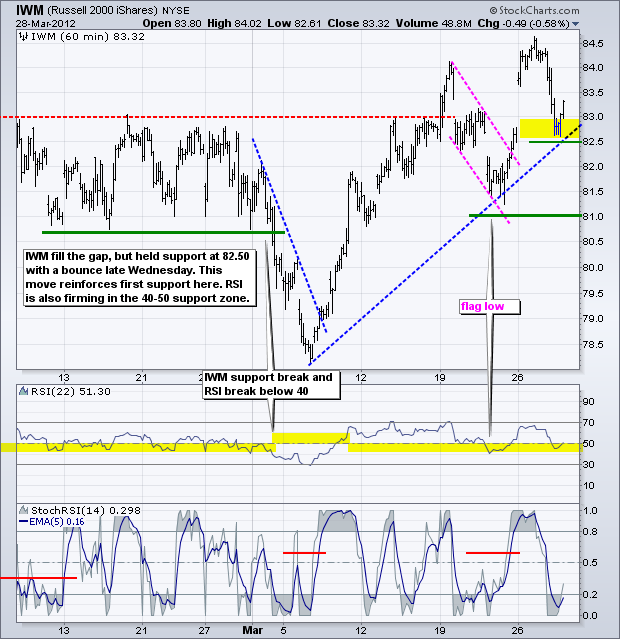
Programming Note: I will be on family vacation the next two weeks and Art's Charts will return on Monday, April 16th. Chinese stocks are under pressure again this morning, but US stock futures are holding fairly firm – so far. Perhaps US stocks look good relative to parts of Asia and Europe. On the 60-minute chart, the S&P 500 ETF (SPY) declined to the 140 area and firmed on Wednesday. This area marks Monday's gap and the flag breakout, which combine for a support zone. Filling the gap-surge is negative, but stocks surged in the final hour and SPY closed near 140.50. I am now re-setting first support at 139.50 and maintaining key support at 138.50. RSI remains in bull mode as it holds above the 40-50 support zone.
**************************************************************************
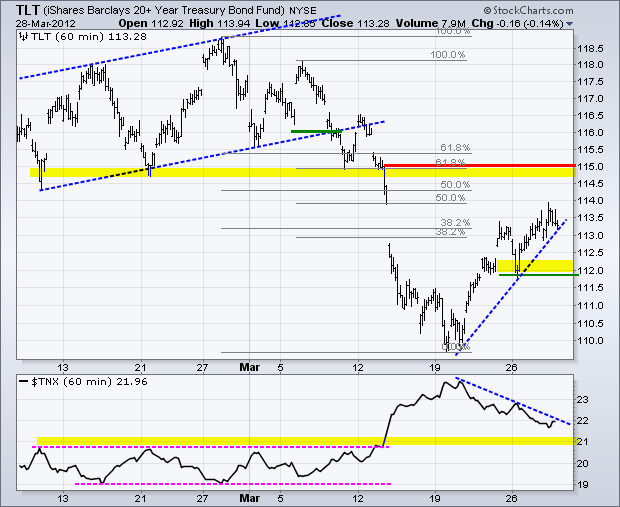
No change. Treasuries remain fairly resilient with a 5-day advance, but this move still looks like an oversold bounce within a bigger downtrend. Monday's low marks upswing support and a move below this level would reverse the current upswing. Should this upswing continue, broken support and the Fibonacci cluster mark the next resistance level in the 114.5-115 area. Watch stocks for clues. Continued strength in stocks would weigh on treasuries, but weakness in stocks would likely strengthen treasuries.
**************************************************************************
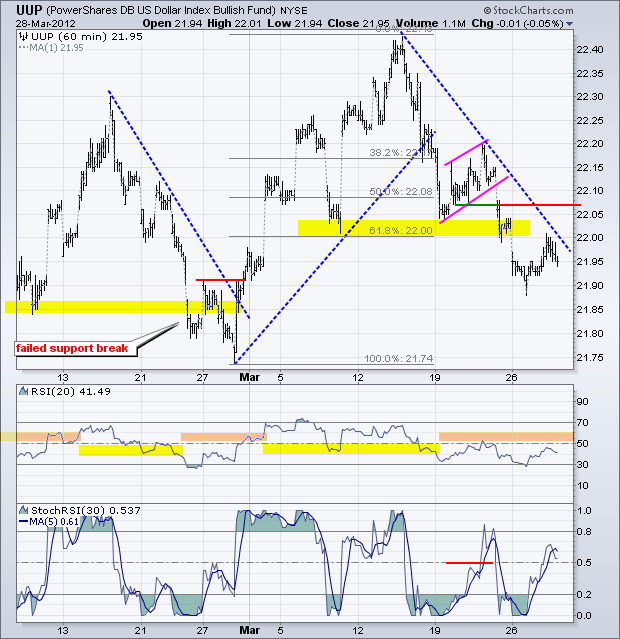
No change. The US Dollar Fund (UUP) remains in a two week downtrend that exceeded the 61.80% retracement line. While the ETF remains above the late February low, we have yet to see a reversal that would actually forge a higher low. Keep in mind that the ETF forged a higher high in mid March. I am setting key resistance at 22.08 for now. A move above this level would break the mid March trendline and negate the flag break. Also look for RSI to break above 60 to confirm.
**************************************************************************
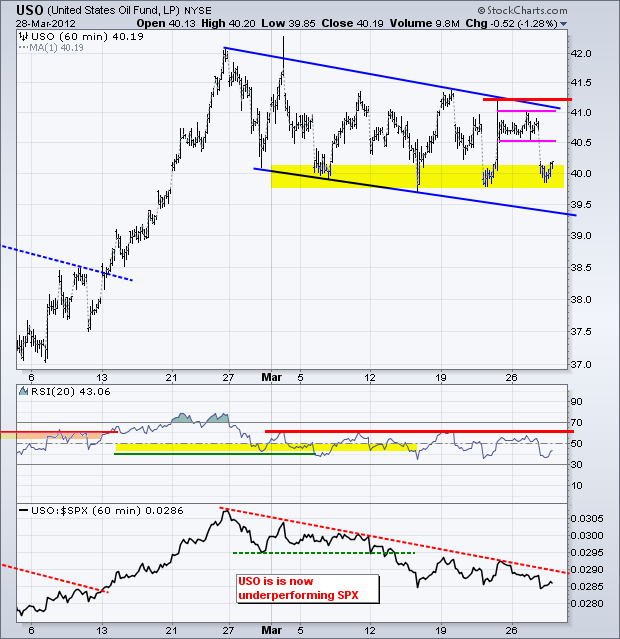
The US Oil Fund (USO) remains in a downtrend since late February. Within this downtrend, the ETF failed near resistance and broke consolidation support with a sharp decline on Wednesday. Support at 40 is proving quite stubborn, but the edge remains with the bears right now. RSI continues to fail in the 50-65 zone this month and a breakout is needed to put momentum in the bullish camp. USO resistance remains at 41.30.
**************************************************************************
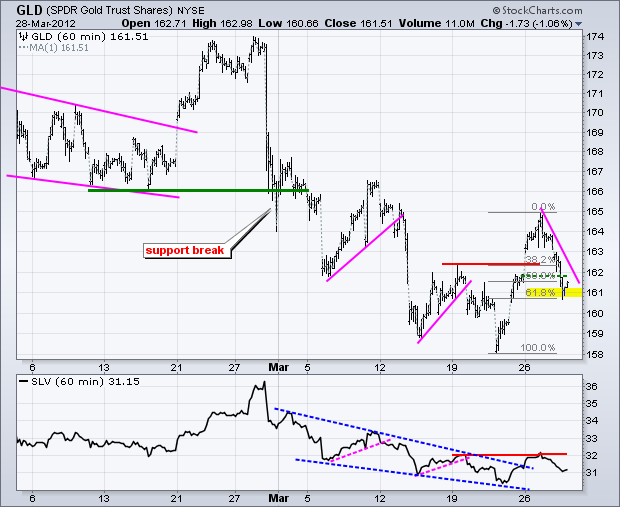
The Gold SPDR (GLD) failed to hold its breakout and plunged below 162 with a sharp decline. Comments from Bernanke produced the breakout on Monday, but "different" comments triggered selling pressure on Wednesday. Here's the funny thing: Bernanke has really not said anything different in the last two weeks. He remains cautiously positive, but ready to act should the need arise. GLD has now retraced 61.80% of the prior surge (158-165). Look for a move above 162.50 to break the downswing trendline and put the bulls back in the driver's seat. Watch China, the Dollar and industrial commodities as well. Weakness in China, a rebound in the Dollar and further weakness in industrial metals would be negative for bullion.
**************************************************************************
Key Economic Reports:
Thu - Mar 29 - 08:30 - Jobless Claims
Thu - Mar 29 - 08:30 - GDP
Fri - Mar 30 - 08:30 - Personal Income & Spending
Fri - Mar 30 - 09:45 - Chicago PMI
Fri - Mar 30 - 09:55 - Michigan Sentiment
Charts of Interest: Tuesday and Thursday in separate post.
This commentary and charts-of-interest are designed to stimulate thinking. This analysis is not a recommendation to buy, sell, hold or sell short any security (stock ETF or otherwise). We all need to think for ourselves when it comes to trading our own accounts. First, it is the only way to really learn. Second, we are the only ones responsible for our decisions. Think of these charts as food for further analysis. Before making a trade, it is important to have a plan. Plan the trade and trade the plan. Among other things, this includes setting a trigger level, a target area and a stop-loss level. It is also important to plan for three possible price movements: advance, decline or sideways. Have a plan for all three scenarios BEFORE making the trade. Consider possible holding times. And finally, look at overall market conditions and sector/industry performance.

