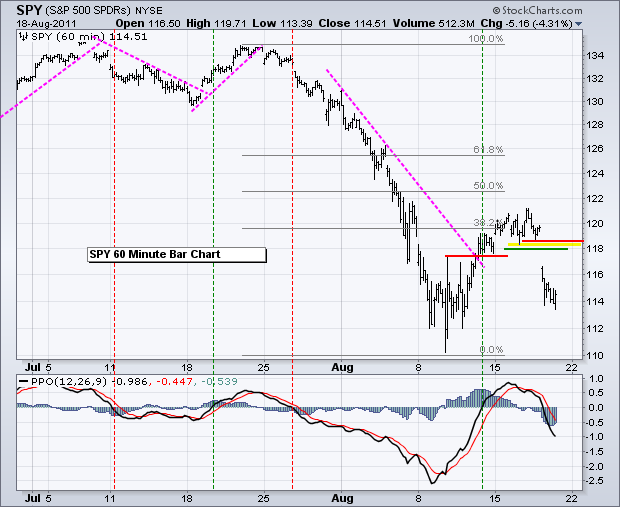
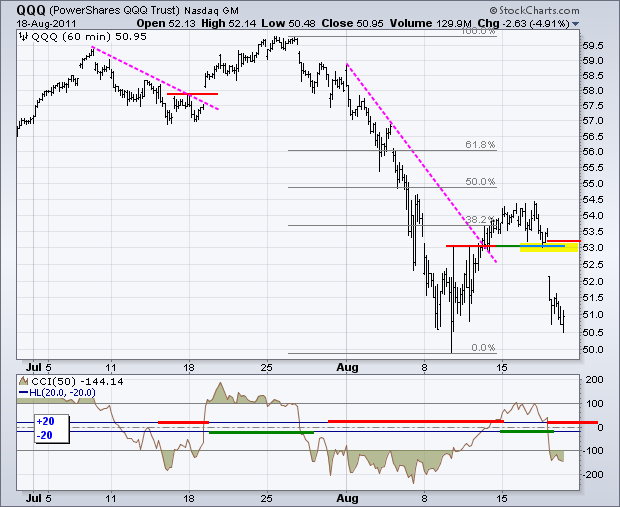
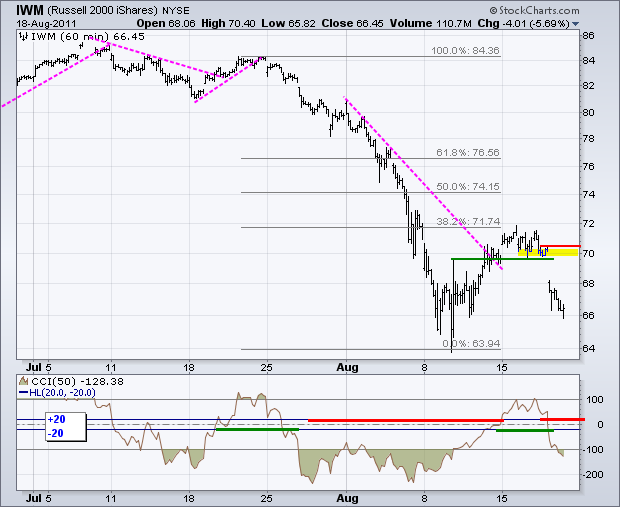
Selling pressure hit the stock market hard on Thursday as the major index ETFs declined sharply. Small-caps and mid-caps led the way lower as their respective indices declined over 5%. All sectors were lower. The defensive sectors held up the best with consumer staples and utilities declining less than 2% and healthcare falling 3.29%. The remaining six sectors were down 4.84% or more. This was one of those "blood in the streets" selling days as the CBOE Volatility Index ($VIX) moved above 40. SPY, QQQ and IWM never made it to their 50% retracement marks on this oversold bounce. After breaching the 38.2% retracement lines, the ETFs gapped down, broke support and stayed down. The short-term trends are now down again with these gaps zones marking first resistance. The Percent Price Oscillator (PPO) moved into negative territory for SPY, while CCI for QQQ and IWM moved below -20 to turn momentum bearish.
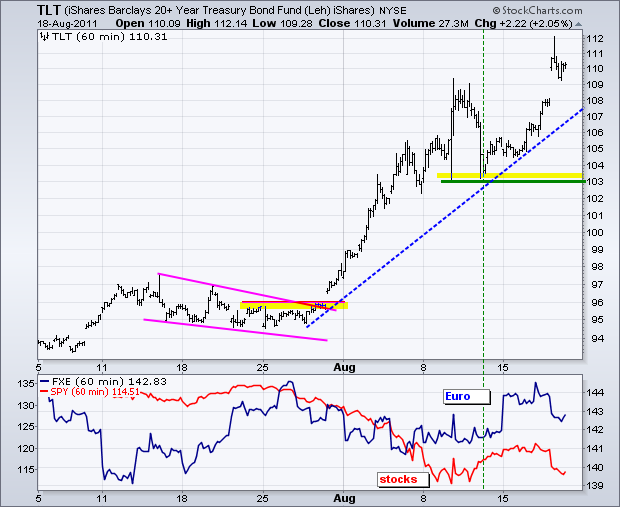
The 20+ year Bond ETF (TLT) extended its run as Treasuries provided a safe-haven on Thursday. Such unbridled strength in Treasuries also bodes ill for the economy. We may not be in for a double dip, but the growth prospects have certainly declined over the last four weeks. The outlook for the economy will remain subdued as long as Treasuries are in an uptrend.
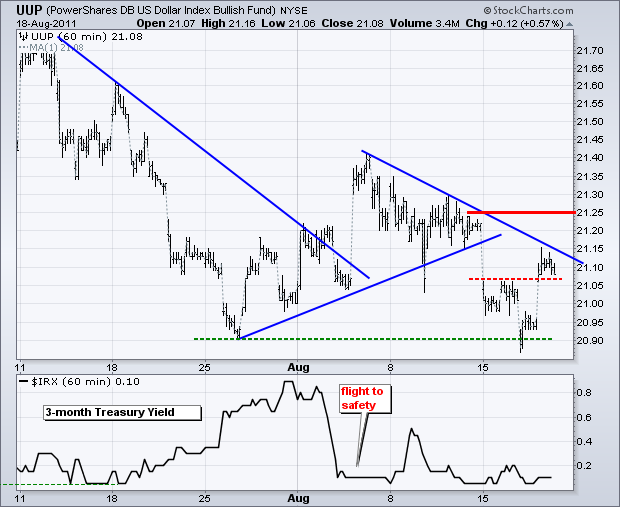
In an interesting twist, the Yen ETF (FXY) and Swiss Franc Trust (FXF) edged lower on Thursday and the Dollar bounced. The Yen and Swissy are usually the safe-haven currencies. The Dollar is also viewed as a safe-haven in times of turmoil. Even so, the US Dollar Fund (UUP) remains in a downtrend over the last two weeks and has yet to break above resistance. UUP bounced off support with yesterday's flight to safety. Further strength above 21.25 is needed to fully reverse the short-term downtrend.
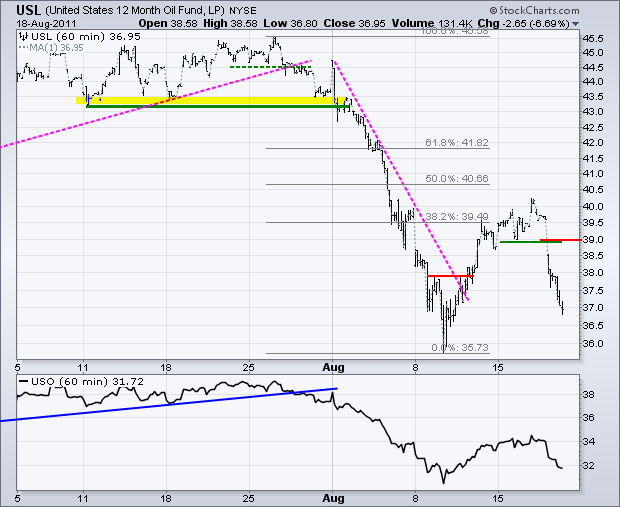
The 12-Month US Oil Fund (USL) followed the stock market and economic prospects lower with a big support break. USL gapped down and fell over 6%. The demand side of the equation has been diminished as economic growth stutters. The gap zone becomes the first resistance zone to watch.
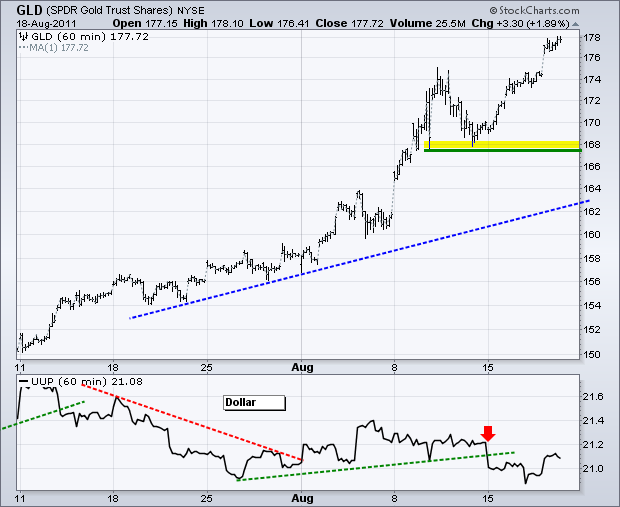
The Gold SPDR (GLD) chart looks about the same as the 20+ year Bond ETF (TLT) chart. Demand for safety and currency alternatives is fueling the rise in both assets. Support for GLD is set in the 168 area.
Key Economic Reports:
Fri - Aug 19 - 09:00 – None TGIF
Charts of Interest: Tuesday and Thursday in separate post.
This commentary and charts-of-interest are designed to stimulate thinking. This analysis is not a recommendation to buy, sell, hold or sell short any security (stock ETF or otherwise). We all need to think for ourselves when it comes to trading our own accounts. First, it is the only way to really learn. Second, we are the only ones responsible for our decisions. Think of these charts as food for further analysis. Before making a trade, it is important to have a plan. Plan the trade and trade the plan. Among other things, this includes setting a trigger level, a target area and a stop-loss level. It is also important to plan for three possible price movements: advance, decline or sideways. Have a plan for all three scenarios BEFORE making the trade. Consider possible holding times. And finally, look at overall market conditions and sector/industry performance.

