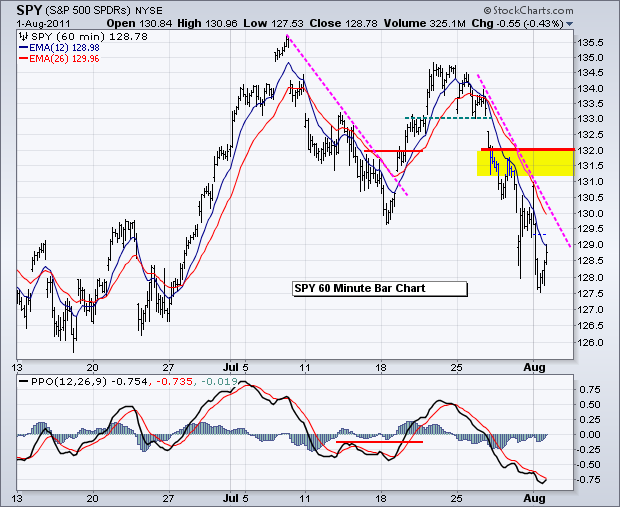
Trading turned quite volatile on Monday as stocks opened sharply higher, moved sharply lower and then recovered somewhat. Despite all this pushing and shoving, the major index ETFs closed slightly lower and all sector SPDRs were down for the day. Stocks did not follow through on the strong open and this is negative. Overall, there was more selling pressure than buying pressure on Monday. Volatility may continue because we have a slew of economic reports to look forward to this week.
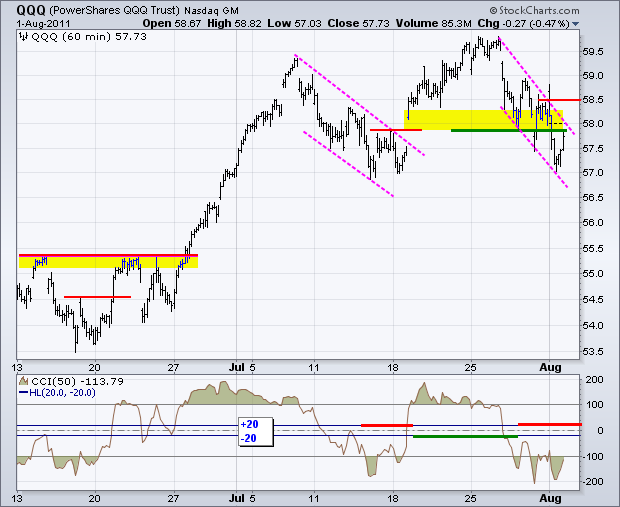
The first chart shows QQQ opening above 58.5 in an apparent break above the flag trendline. This break did not last long as the ETF quickly moved back below 58. Led by Apple, QQQ has been the strongest of the major index ETFs. It is still holding up the best, but big techs are not totally immune to selling pressure. The short-term trend is down as long as the flag/wedge falls. Look for a break above 58.5 on the price chart and +20 in CCI to reverse this downtrend.
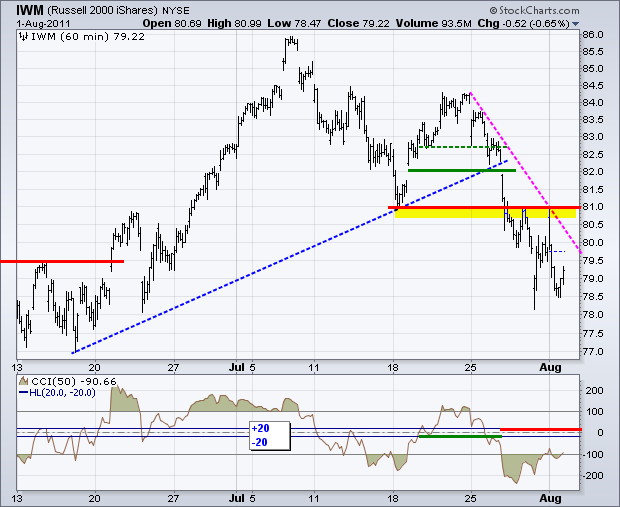
IWM surged to 81 on the open and then plunged back below 79. Even though the ETF held above last week's low, there are no signs of strength here. Key resistance is set at 81 for IWM and +20 for CCI.
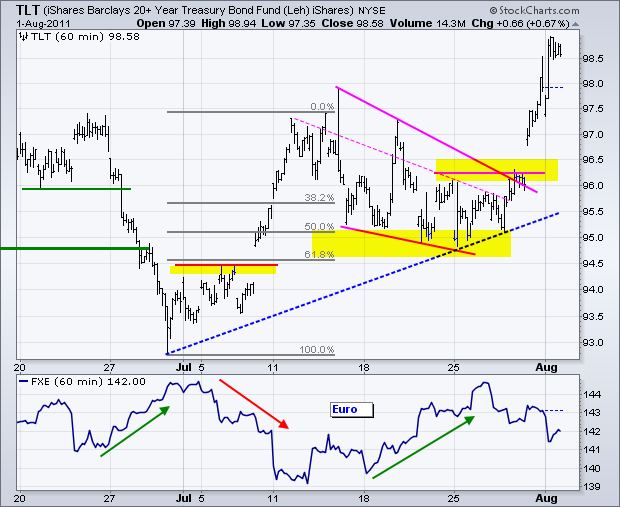
The 20+ year Bond ETF (TLT) has been reacting to the economic situation all along. Even with the debt-ceiling debacle and the hollow threat of default, bonds held their ground and even moved higher the last two weeks. With stocks under pressure and the ISM Manufacturing report falling well short of expectations, bonds surged again on Monday. TLT broke above its June-July highs and hit a 52-week high. No signs of weakness here.
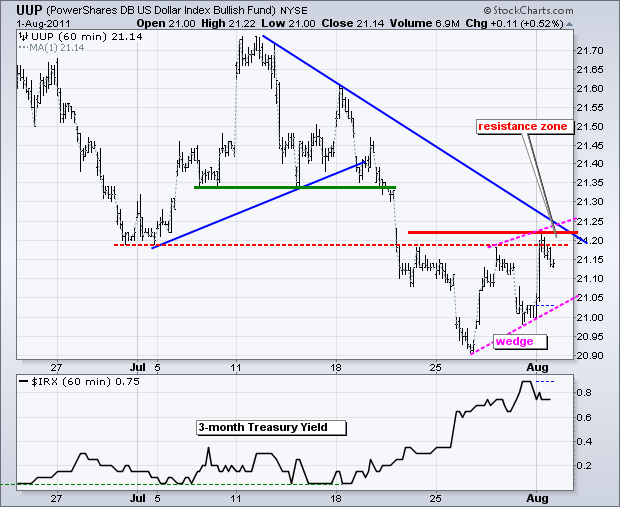
The US Dollar Fund (UUP) moved higher as a flight to quality took hold on Monday. This means money was moving out of the Euro, which caused the Dollar to move higher. It was not so much that money was buying the Dollar. Euro/Dollar has become a contest of the least ugly, not the prettiest. The Yen ETF (FXY) and the Swiss Franc Trust (FXF) are the real safe-haven stars. A rising flag/wedge has taken shape the last few days in UUP. This is tricky. While the wedge/flag is a bearish corrective pattern, further weakness in stocks and strength in bonds would likely push UUP higher. At what point does this four-day uptrend become a bigger uptrend? I would say a break above 21.25 would argue for a trend reversal in the UUP. Last week's highs and the July trendline mark resistance here.
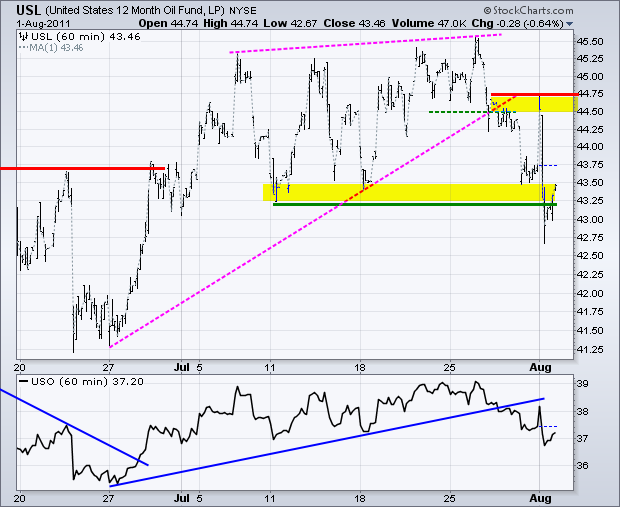
The 12-Month US Oil Fund (USL) is going the way of the stock market and is influenced by the Dollar. USL surged on the open, but fell back as selling pressure took over in stocks. USL broke support at 43.25 and I will now mark key resistance at 44.75. Bonds are also watching oil. Weakness in commodities lessens inflationary pressures and is bullish for bonds.
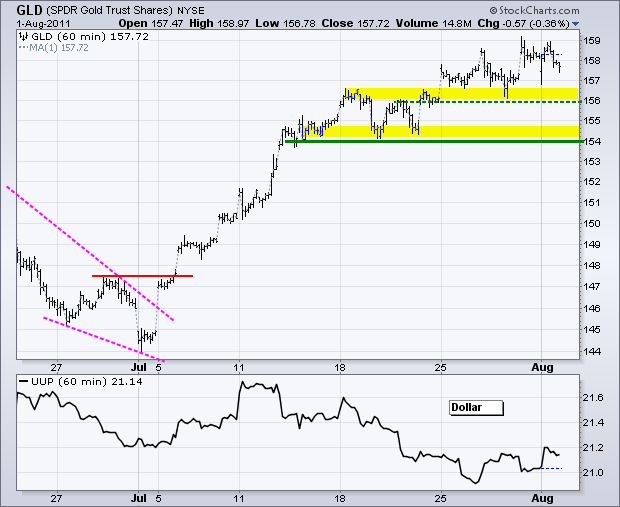
There is no change in the Gold SPDR (GLD) as the uptrend remains in place. Gold came under pressure on the open, but quickly recovered as a new crisis emerged (economic). First support resides at 156 and key support resides at 154.
Key Economic Reports:
Tue - Aug 02 - 08:30 - Personal Income
Tue - Aug 02 - 15:00 - Auto/Truck Sales
Wed - Aug 03 - 07:00 - MBA Mortgage Index
Wed - Aug 03 - 08:15 - ADP Employment Report
Wed - Aug 03 - 10:00 - Factory Orders
Wed - Aug 03 - 10:00 - ISM Services
Wed - Aug 03 - 10:30 - Oil Inventories
Thu - Aug 04 - 08:30 - Jobless Claims
Fri - Aug 05 - 08:30 - Employment Report
Charts of Interest: Tuesday and Thursday in separate post.
This commentary and charts-of-interest are designed to stimulate thinking. This analysis is not a recommendation to buy, sell, hold or sell short any security (stock ETF or otherwise). We all need to think for ourselves when it comes to trading our own accounts. First, it is the only way to really learn. Second, we are the only ones responsible for our decisions. Think of these charts as food for further analysis. Before making a trade, it is important to have a plan. Plan the trade and trade the plan. Among other things, this includes setting a trigger level, a target area and a stop-loss level. It is also important to plan for three possible price movements: advance, decline or sideways. Have a plan for all three scenarios BEFORE making the trade. Consider possible holding times. And finally, look at overall market conditions and sector/industry performance.

