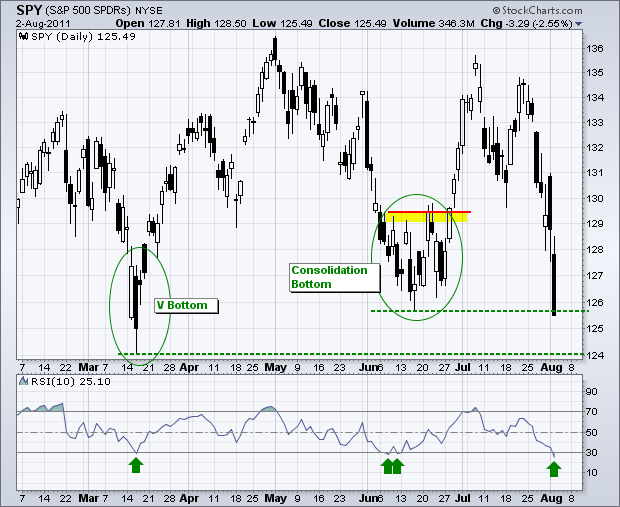
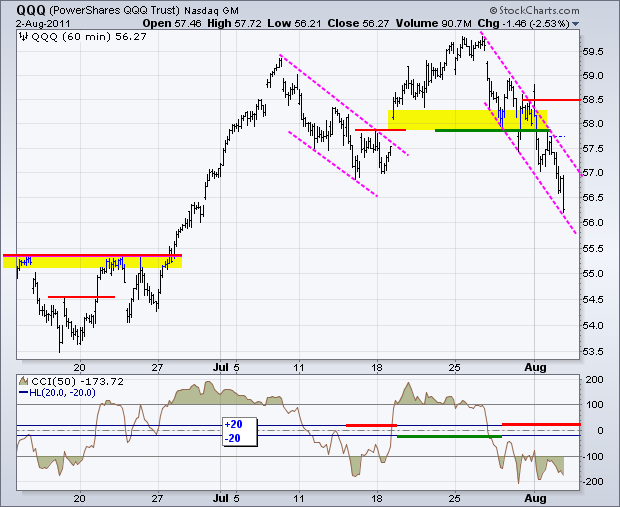
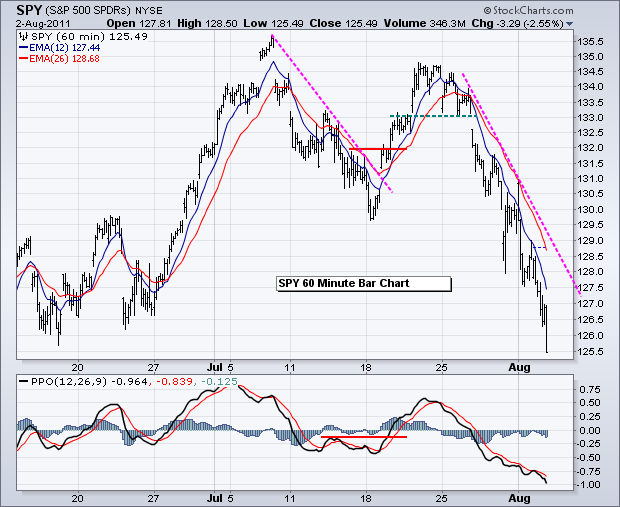
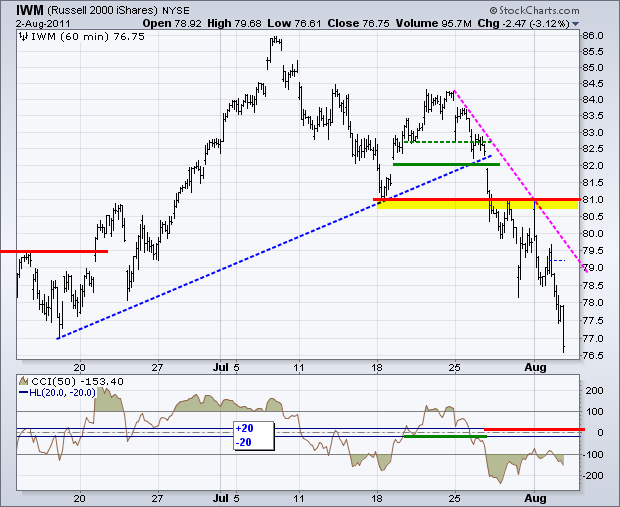
Stocks are now very oversold with some long-term support levels coming into play. Over the last seven trading days, IWM is down 8.69%, SPY is down 6.75% and QQQ is down 5.59%. 10-day RSI moved below 30 for SPY and IWM, but remains above 30 for QQQ. Prior readings below 30 produced oversold bounces in March and June for SPY. As far as long-term support is concerned, IWM moved just below its March-June lows. SPY broke its June low, but remains above its March low. QQQ is well above the March June lows. On the chart below, SPY formed a "V" bottom in March and a consolidation bottom in June. Given the technical damage of the last three weeks, I think the market needs time to heal before we will see a sustainable bounce. This means we are likely to see a consolidation or choppy range before we can expect a bounce.
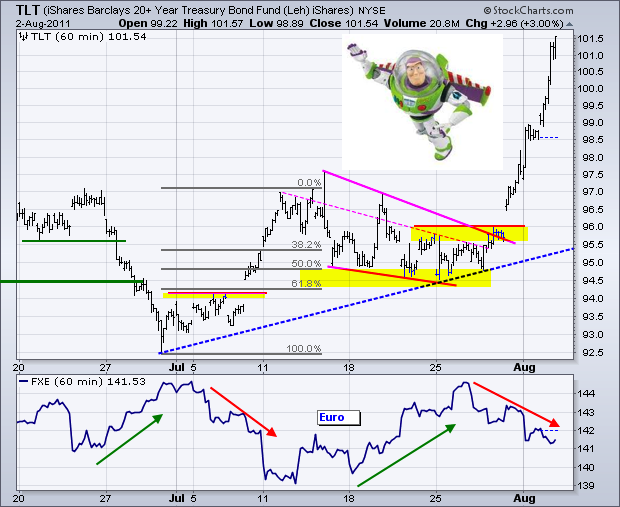
The 20+ year Bond ETF (TLT) soared with a 3% surged above 101.5 on Wednesday. It is to infinity and beyond for bonds (and Buzz Lightyear). Treasuries are benefiting from a flight to safety and weak economic numbers. Bonds are as overbought as stocks are oversold.
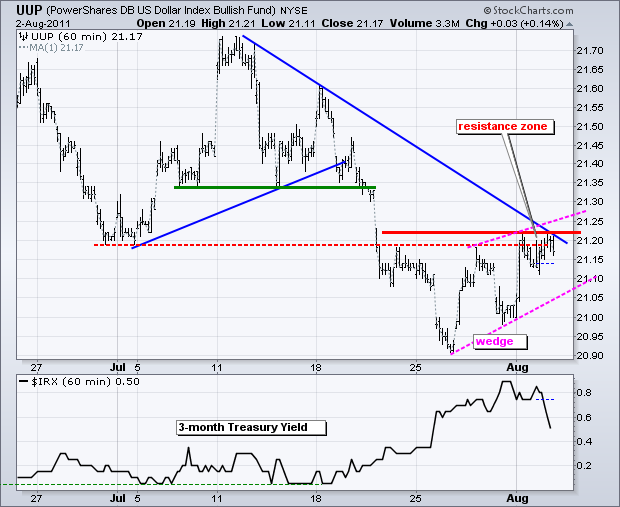
Despite a surge in bonds and decline in stocks, the US Dollar Fund (UUP) barely budged and failed to break above resistance. I would have expected a bigger move in the Dollar with the risk-off trade taking center stage. The inability of the Dollar to breakout is a bearish sign. A rising wedge has taken shape and a break below the wedge trendline would signal a continuation lower. Note that the Euro Currency Trust (FXE) has a falling wedge over the last several days.
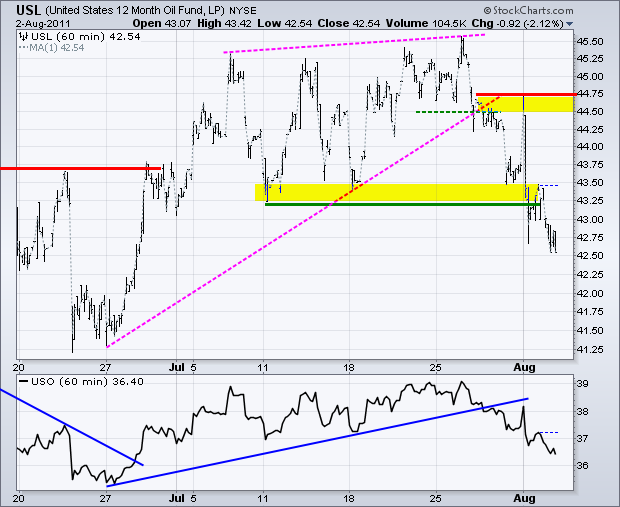
The 12-Month US Oil Fund (USL) moved lower along with stocks. USL is also getting oversold and ripe for a bounce or consolidation. However, oil is likely dependent on the stock market for direction.
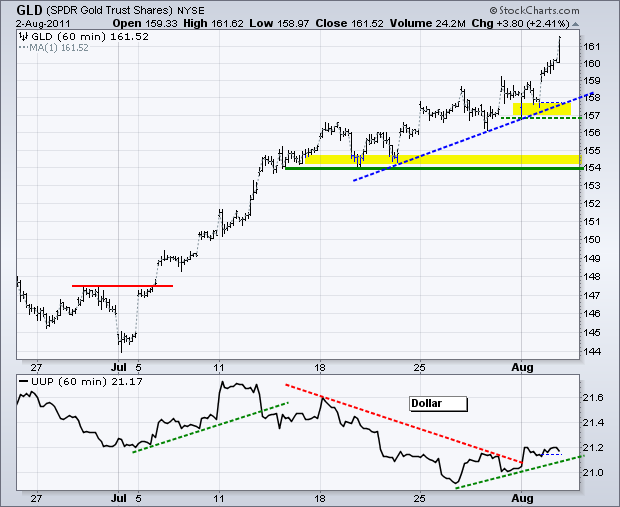
The Gold SPDR (GLD) surged above 161 as the safe-haven bet. Gold remains the alternative to stocks and currencies. Bonds still have their safe-haven status. Think what would happen to gold if bonds lost this safe-haven status. First support has been raised to 157 and key support remains at 154.
Key Economic Reports:
Wed - Aug 03 - 07:00 - MBA Mortgage Index
Wed - Aug 03 - 08:15 - ADP Employment Report
Wed - Aug 03 - 10:00 - Factory Orders
Wed - Aug 03 - 10:00 - ISM Services
Wed - Aug 03 - 10:30 - Oil Inventories
Thu - Aug 04 - 08:30 - Jobless Claims
Fri - Aug 05 - 08:30 - Employment Report
Charts of Interest: Tuesday and Thursday in separate post.
This commentary and charts-of-interest are designed to stimulate thinking. This analysis is not a recommendation to buy, sell, hold or sell short any security (stock ETF or otherwise). We all need to think for ourselves when it comes to trading our own accounts. First, it is the only way to really learn. Second, we are the only ones responsible for our decisions. Think of these charts as food for further analysis. Before making a trade, it is important to have a plan. Plan the trade and trade the plan. Among other things, this includes setting a trigger level, a target area and a stop-loss level. It is also important to plan for three possible price movements: advance, decline or sideways. Have a plan for all three scenarios BEFORE making the trade. Consider possible holding times. And finally, look at overall market conditions and sector/industry performance.

