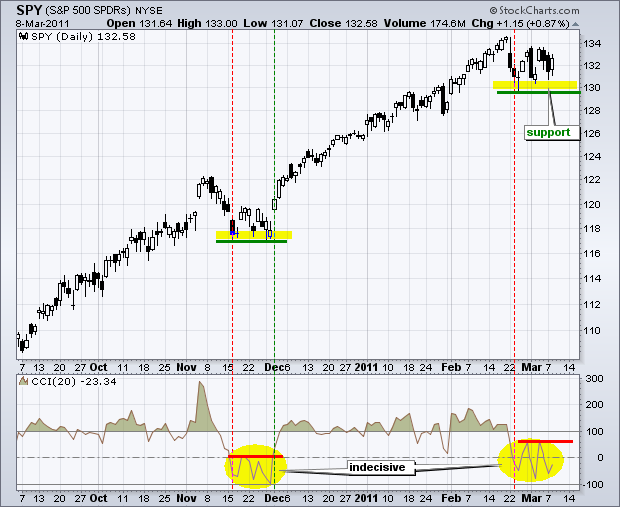
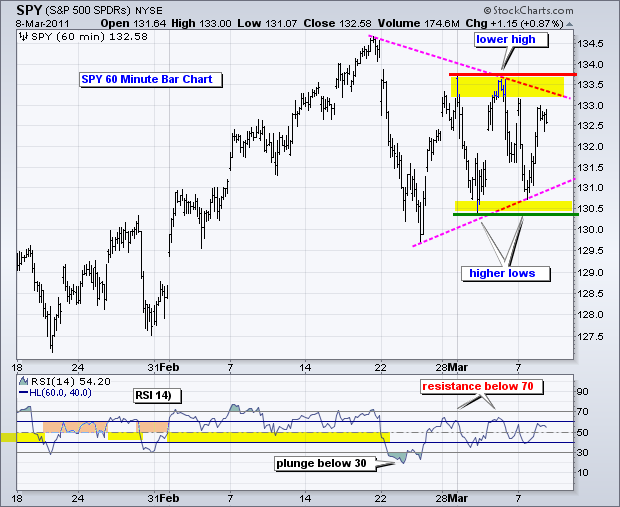
Even though the bulk of the short-term evidence has shifted to the bears, the bulls refuse to give way as the S&P 500 ETF (SPY) holds support. Four out of four breadth indicators moved below their bearish thresholds. RSI on the 60-minute chart plunged below 30 in late February and failed to reach 70 on the last two bounces. These indicators favor the bears, but the overall trends favor the bulls. What pulls the most weight? It is certainly a tough call, but I must give more weight to the price chart and overall trend. The medium-term trend (daily chart) is clearly up. Keep an eye on the Friday indicator summary for changes in the medium-term picture. Short-term, SPY surged the first three weeks of February and then consolidated with a triangle over the last 2 1/2 weeks. A consolidation after a sharp advance is a bullish continuation pattern. SPY is nearing a resistance zone around 133-133.7 for at least the third test this month. Nimble traders might consider turning bearish near resistance and bullish near support to maximize the risk-reward ratio. It will take a convincing support or resistance break to provide the next directional signal.

Key Economic Reports/Events:
Wed - Mar 09 - 07:00 - MBA Mortgage Index
Wed - Mar 09 - 10:30 - Crude Inventories
Thu - Mar 10 - 08:30 - Jobless Claims
Fri - Mar 11 - 08:30 - Retail Sales
Fri - Mar 11 - 09:55 - Michigan Sentiment
Fri - Mar 11 - 10:00 - Business Inventories
Charts of Interest: Tuesday and Thursday in separate post.
-----------------------------------------------------------------------------
This commentary and charts-of-interest are designed to stimulate thinking. This analysis is not a recommendation to buy, sell, hold or sell short any security (stock ETF or otherwise). We all need to think for ourselves when it comes to trading our own accounts. First, it is the only way to really learn. Second, we are the only ones responsible for our decisions. Think of these charts as food for further analysis. Before making a trade, it is important to have a plan. Plan the trade and trade the plan. Among other things, this includes setting a trigger level, a target area and a stop-loss level. It is also important to plan for three possible price movements: advance, decline or sideways. Have a plan for all three scenarios BEFORE making the trade. Consider possible holding times. And finally, look at overall market conditions and sector/industry performance.

