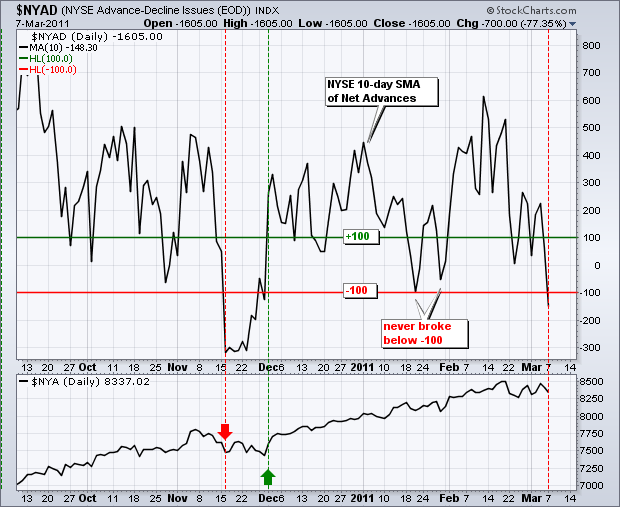
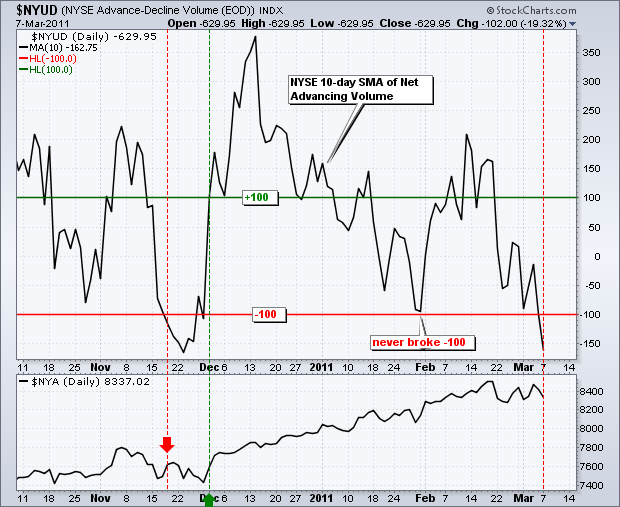
With another day of selling pressure, the 10-day SMAs for the NYSE Net Advances ($NYAD) and NYSE Net Advancing Volume ($NYUD) moved below -100. These indicators now join the 10-day SMAs for Nasdaq Net Advances ($NAAD) and Nasdaq Net Advancing Volume ($NAUD) with bearish signals. Keep in mind that this is a trend following signal. In other words, it is rests on the premise that we have seen sufficient weakness to expect further weakness. These signals could last a few weeks or just a few days. The late November signals lasted around 2 weeks and resulted in a whipsaw because the medium-term uptrend pulled overpowered this short-term dip. A repeat is certainly possible here because the medium-term trends remain up for the major index ETFs. A mean reversion trader would view these breadth signals as an oversold sign and expect a bounce or short-term bullish reversal soon. Even mean-reversion traders would likely wait for some signs of strength. A surge back into positive territory (above zero) would be the earliest possible sign of strength in these breadth indicators.

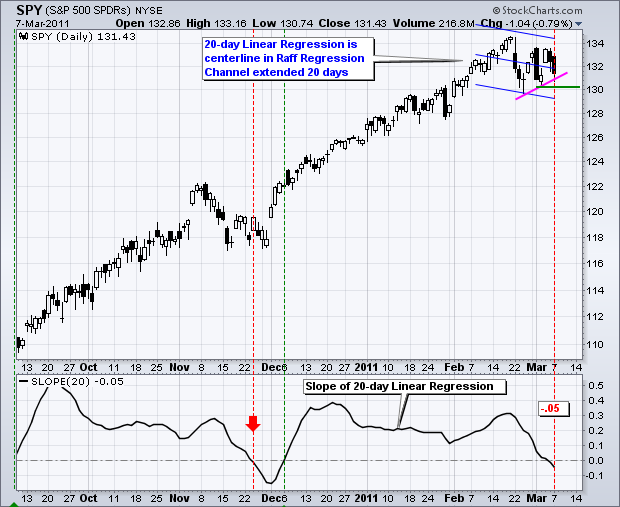
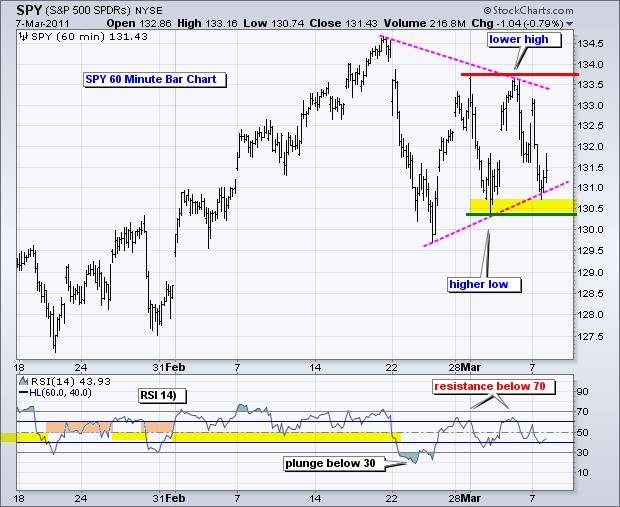
The bulk of the short-term evidence has shifted to the bears. Four out of four breadth indicators moved below their bearish thresholds. RSI on the 60-minute chart plunged below 30 in late February and failed to reach 70 on the last two bounces. On the price charts, the 20-day Sloped turned negative with Friday's close and remains negative. This indicates a slight downtrend over the last 20-day days. Technically, this means the 20-day Linear Regression slopes down.

The 60-minute chart remains the lone holdout here as SPY trades within a triangle formation. Monday's opening gap stalled around 133 and the ETF declined below 131 with a rather sharp decline. There is support in the 130.3-131 area from the March lows and resistance in the 133.7 area from the March highs. A break below the March lows would provide the final piece of the bearish puzzle. Keep in mind that I am talking short-term (1-4 weeks). We have yet to see a medium-term bearish signal. Moreover, the medium-term uptrend could overpower a short-term bearish signal at anytime.

Key Economic Reports/Events:
Wed - Mar 09 - 07:00 - MBA Mortgage Index
Wed - Mar 09 - 10:30 - Crude Inventories
Thu - Mar 10 - 08:30 - Jobless Claims
Fri - Mar 11 - 08:30 - Retail Sales
Fri - Mar 11 - 09:55 - Michigan Sentiment
Fri - Mar 11 - 10:00 - Business Inventories
Charts of Interest: Tuesday and Thursday in separate post.
-----------------------------------------------------------------------------
This commentary and charts-of-interest are designed to stimulate thinking. This analysis is not a recommendation to buy, sell, hold or sell short any security (stock ETF or otherwise). We all need to think for ourselves when it comes to trading our own accounts. First, it is the only way to really learn. Second, we are the only ones responsible for our decisions. Think of these charts as food for further analysis. Before making a trade, it is important to have a plan. Plan the trade and trade the plan. Among other things, this includes setting a trigger level, a target area and a stop-loss level. It is also important to plan for three possible price movements: advance, decline or sideways. Have a plan for all three scenarios BEFORE making the trade. Consider possible holding times. And finally, look at overall market conditions and sector/industry performance.

