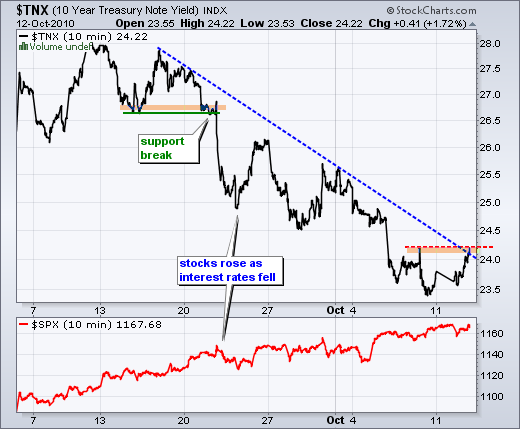
Maybe it is just coincidence, but there sure is a strong negative correlation between the Dollar and stocks. Stocks started weak as the Dollar surged in early trading. The FOMC minutes hit the market in the afternoon and the Dollar swooned as QE2 became more of a reality. QE2 and a higher inflation target mean the Dollar will become more diluted. Stocks surged as the Dollar declined and the Euro rose. The first chart shows the Euro Currency Trust (FXE) rising from mid September until early October. A megaphone flag formed over the last few days and a break above 139 would signal yet another continuation higher. The second chart shows the 10-year Treasury Yield ($TNX) falling from 2.8% to 2.35% over the last 4-5 weeks. Bonds are rising and interest rates are falling in anticipation of the Fed's buy program. Falling interest rates are also contributing to Dollar weakness. I wonder how long this can continue because most of the QE2 news must surely be priced into the bond market. $TNX is currently at short-term resistance and a breakout would call for an oversold bounce in yields and an overbought pullback in bonds. A rise in interest rates could lift the Dollar.

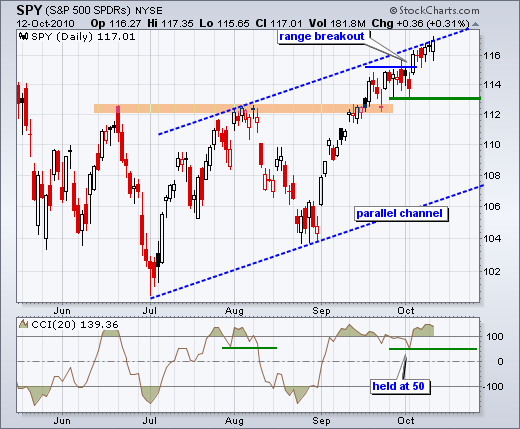
There is not much change on the daily chart. SPY broke above consolidation resistance last week and this breakout held. Strong breakouts hold. Weak ones fold. A rising price channel is still possible with resistance around 117, but the short-term and medium-term uptrends dominate current price action. These uptrends make resistance levels potential and support levels key. I am marking key support at 113. CCI remains in bull mode as it moved into positive territory in early September and remained positive throughout. I am setting CCI support at 50 on the daily chart.

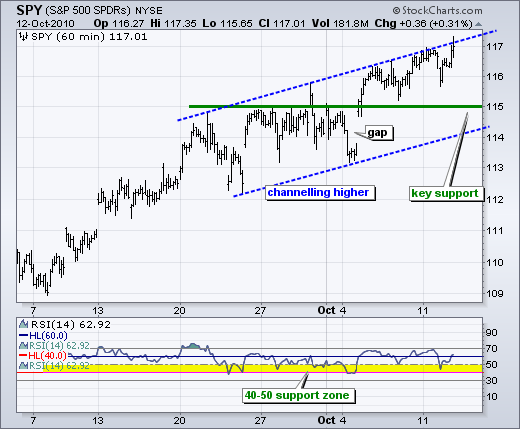
SPY continues to channel higher on the 60-minute chart and is currently at the top of its channel. This means SPY is at the upper channel trendlines on both the daily and 60-minute charts. Broken resistance at 115 turned into support and held late last week. With the surge above 117 on Tuesday, I am raising key support to 115. This level is above the channel trendline, but the channel trendline is rising and will catch up to support in a couple days. RSI remains in bull mode as long as the 40-50 support zone holds.

Key Economic Reports:
Oct 13 - 07:00 - MBA Mortgage Applications
Oct 13 - 10:30 - Oil Inventories
Oct 14 - 08:30 - Jobless Claims
Oct 14 - 08:30 - PPI
Oct 15 - 08:15 - Ben Bernanke Speaks
Oct 15 - 08:30 - CPI
Oct 15 - 08:30 - Retail Sales
Oct 15 - 08:30 - NY Fed Empire Manufacturing Survey
Oct 15 - 09:55 - Michigan Sentiment
Charts of Interest: Tuesday and Thursday.
-----------------------------------------------------------------------------
This commentary and charts-of-interest are designed to stimulate thinking. This analysis is not a recommendation to buy, sell, hold or sell short any security (stock ETF or otherwise). We all need to think for ourselves when it comes to trading our own accounts. First, it is the only way to really learn. Second, we are the only ones responsible for our decisions. Think of these charts as food for further analysis. Before making a trade, it is important to have a plan. Plan the trade and trade the plan. Among other things, this includes setting a trigger level, a target area and a stop-loss level. It is also important to plan for three possible price movements: advance, decline or sideways. Have a plan for all three scenarios BEFORE making the trade. Consider possible holding times. And finally, look at overall market conditions and sector/industry performance.

