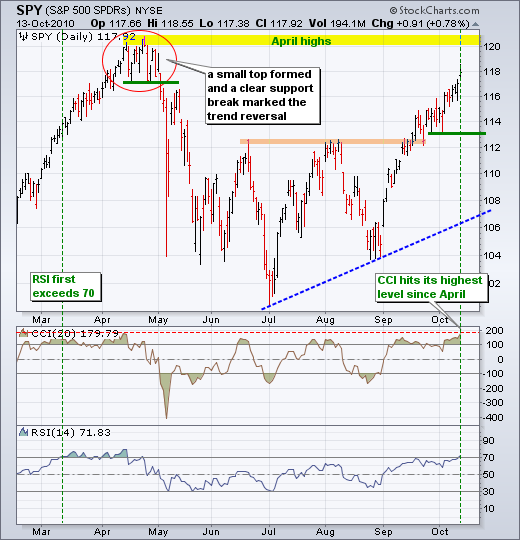
With another surge higher the last four days, the major index ETFs are overbought by most measures. SPY is up over 13% in seven weeks, 14-day RSI moved above 70 and CCI is near 180. RSI was last above 70 in mid April. At the time, the indicator oscillated around 70 from March 12th until April 15th. This means that RSI became technically overbought on March 12th and remained overbought for just over a month. Even with RSI technically overbought, SPY tacked on another 5% from mid March to mid April. With the April highs in sight, it is conceivable that SPY reaches or even surpasses these highs before we see a pullback. A reader asked what I thought about the downtrend in OBV over the last few months. OBV and volume are just indicators and indicators are secondary to price action. The same holds for overbought readings, momentum oscillators and moving averages. These can help, but the actual price chart is the single most important analysis tool (in my humble opinion). That said, key support for SPY remains at 113 and CCI support remains at 50. No downtrend here unless both are broken.

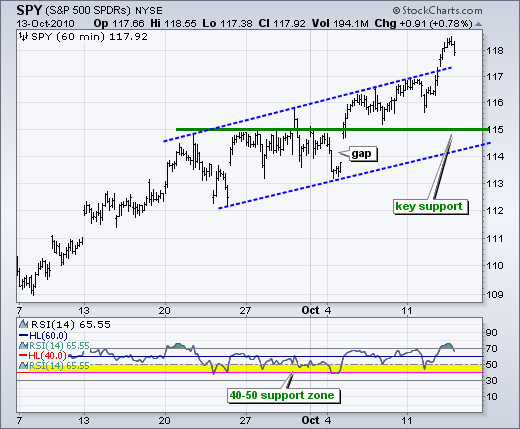
SPY broke above yet another trendline marking the upper boundary of a rising price channel. Other than that, there is no change in the basic assessment. Broken resistance turns into support at 115. Even though this support level is above the blue trendline, I expect the blue trendline to catch up over the next few days. It is, after all, rising with each passing day. RSI remains in bull mode with support in the 40-50 zone. Again, I am not concerned with overbought readings or bearish divergences. Except for a couple of brief dips, RSI has remained within the 40-80 range since early September.

Key Economic Reports:
Oct 14 - 08:30 - Jobless Claims
Oct 14 - 08:30 - PPI
Oct 15 - 08:15 - Ben Bernanke Speaks
Oct 15 - 08:30 - CPI
Oct 15 - 08:30 - Retail Sales
Oct 15 - 08:30 - NY Fed Empire Manufacturing Survey
Oct 15 - 09:55 - Michigan Sentiment
Charts of Interest: Separate post.
-----------------------------------------------------------------------------
This commentary and charts-of-interest are designed to stimulate thinking. This analysis is not a recommendation to buy, sell, hold or sell short any security (stock ETF or otherwise). We all need to think for ourselves when it comes to trading our own accounts. First, it is the only way to really learn. Second, we are the only ones responsible for our decisions. Think of these charts as food for further analysis. Before making a trade, it is important to have a plan. Plan the trade and trade the plan. Among other things, this includes setting a trigger level, a target area and a stop-loss level. It is also important to plan for three possible price movements: advance, decline or sideways. Have a plan for all three scenarios BEFORE making the trade. Consider possible holding times. And finally, look at overall market conditions and sector/industry performance.
