There are likely to be some serious fireworks next week. This is one of the biggest news weeks that I can remember. First, we have election results on Tuesday. Second, the Fed meets on Wednesday. Third, there is the employment report on Friday. We can also throw in the ISM Manufacturing Index, the ISM Services Index, Factory Orders and Auto-Truck Sales. We may get a buy-the-rumor and sell-the-news scenario for the elections. There has been a run-up heading into the elections and this means we may see a decline after the elections. However, any bets may be put on hold until after Wednesday's Fed announcement or even until after the employment report. It may just be a good week to clean the garage.
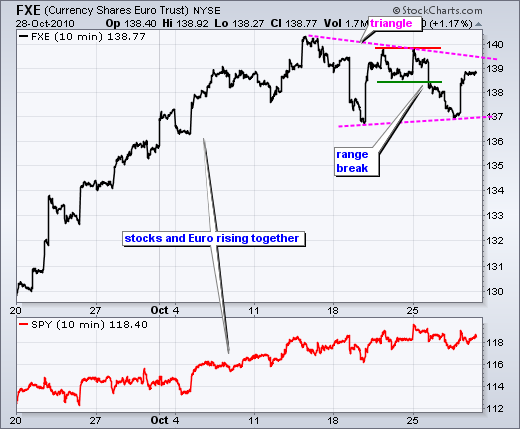
And don't forget that Greece is also making its way back into the news. This will affect the Euro. The chart below shows the Euro Currency Trust (FXE) consolidating with a triangle over the last two weeks. The range break earlier this week gives a bearish bias and it would take a break above 139.5 to negate this signal. A move below 137 would be bearish for the Euro and bullish for the Dollar.
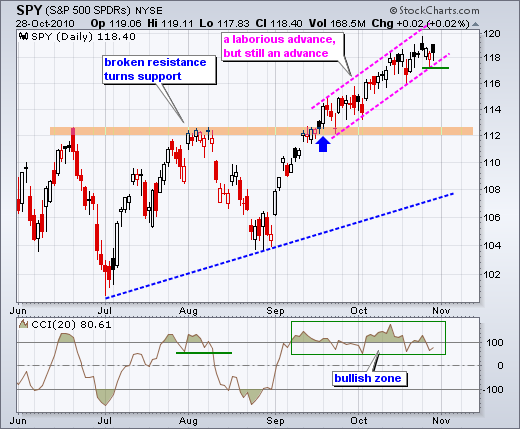
There is no change on the daily chart. Even though the advance has grown laborious, SPY remains in an uptrend. The surge above 114 on September 20th marked the easy part of the advance. Since this surge, SPY has worked its way higher within a rising price channel. All kinds of indecisive and bearish candlesticks formed, but these were never confirmed with a downside move. A break below channel support at 117 would argue for a pullback towards broken resistance around 112. CCI remains in its bull zone and has yet to break 50 to signal weakness in momentum.

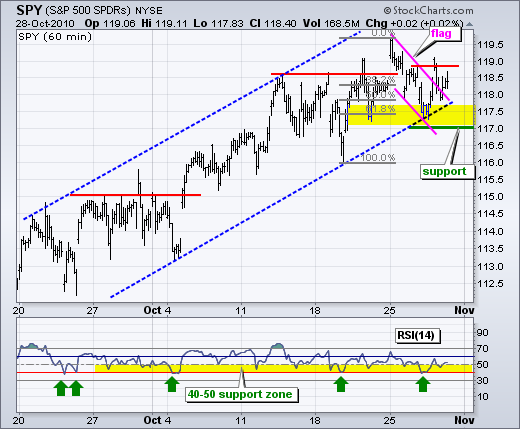
On the 60-minute chart, SPY bounced of channel support and RSI bounced of 40 to keep the uptrend alive. The decline over the last three days looks like a falling flag, which is a bullish corrective pattern. In fact, also notice that the falling flag retraced around 62% of last week's advance. SPY dipped below 117.5 yesterday afternoon, but a late rally pushed the ETF above 118 by the close. Further strength above flag resistance would signal yet another continuation higher. RSI bounced off 40 for at least the fifth time in six weeks. This support level has certainly earned its keep. A convincing trend reversal will not occur until RSI breaks 40 AND SPY breaks below 117.

Key Economic Reports:
Oct 29 - 08:30 - GDP
Oct 29 - 09:45 - Chicago PMI
Oct 29 - 09:55 - Michigan Sentiment
Charts: Tuesday and Thursday in separate post.
-----------------------------------------------------------------------------
This commentary and charts-of-interest are designed to stimulate thinking. This analysis is not a recommendation to buy, sell, hold or sell short any security (stock ETF or otherwise). We all need to think for ourselves when it comes to trading our own accounts. First, it is the only way to really learn. Second, we are the only ones responsible for our decisions. Think of these charts as food for further analysis. Before making a trade, it is important to have a plan. Plan the trade and trade the plan. Among other things, this includes setting a trigger level, a target area and a stop-loss level. It is also important to plan for three possible price movements: advance, decline or sideways. Have a plan for all three scenarios BEFORE making the trade. Consider possible holding times. And finally, look at overall market conditions and sector/industry performance.

