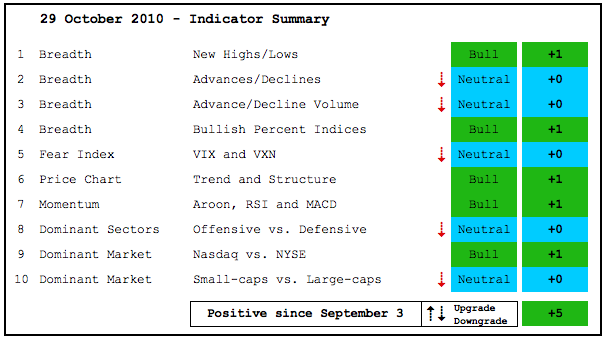
The indicator summary remains bullish overall, but five indicators were downgraded from bullish to neutral. First, the NYSE AD Volume Line peaked in mid October and is starting to lag. Second, the Nasdaq AD Line flattened as the Nasdaq continued higher. Third, the S&P 500, Nasdaq 100, VIX and VXN have all been edging higher since mid October. This is not normal. Fourth, two of the four offensive sectors are lagging. Finance remains the big laggard and now industrials are showing relative weakness. And finally, the Russell 2000/S&P 100 ratio peaked in mid October. These are early signs that amount to non-confirmation. In other words, the market is moving higher without confirmation from these indicators. These indicators have yet to actually reverse and turn bearish though. I will expand on these in today's Market Message.
- AD Lines: Neutral. The Nasdaq AD Line remains in an uptrend, but flattened the last two weeks as the Nasdaq moved higher. The NYSE AD Line remains in an uptrend.
- AD Volume Lines: Neutral. The Nasdaq AD Volume Line remains in a strong uptrend. The NYSE AD Line also remains in an uptrend, but weakened over the last 2-3 weeks.
- Net New Highs: Bullish. Nasdaq and NYSE Net New Highs are trading below the mid October highs, but remain positive overall. The cumulative Net New Highs lines are still rising.
- Bullish Percent Indices: Bullish. All Bullish Percent Indices are above 50%.
- VIX/VXN: Bullish. The S&P 500 Volatility Index ($VIX) and the Nasdaq 100 Volatility Index ($VXN) remain in downtrends, but both bottomed in mid October, even as the S&P 500 and Nasdaq 100 continued higher.
- Trend Structure: Bullish. QQQQ, SPY, DIA and IWM all broke their summer highs and continued to move higher throughout October.
- SPY Momentum: Bullish. MACD(5,35,5) and Aroon (20) moved into positive territory the second week of September and RSI surged above 60.
- Offensive Sector Performance: Neutral. Finance remains relatively weak and Industrials took a hit the last few weeks. Techs and consumer discretionary are still holding strong though.
- Nasdaq Performance: Bullish. The $COMPQ:$NYA ratio moved above its September high and remains in an uptrend.
- Small-cap Performance: Neutral. The $RUT:$OEX ratio peaked the second week of October and formed a lower high, but has yet to break support to fully reverse the three month uptrend.
- Breadth Charts have been updated (click here)
This table is designed to offer an objective look at current market conditions. It does not aim to pick tops or bottoms. Instead, it seeks to identify noticeable shifts in buying and selling pressure. With 10 indicator groups, the medium-term evidence is unlikely to change drastically overnight. Previous turns include: Positive on 11-Sept. Negative on 5-February. Positive on 5-March. Negative on 11-June. Positive on 18-June. Negative on 24-June. Positive on August 6. Negative on August 13. Positive on September 3.

