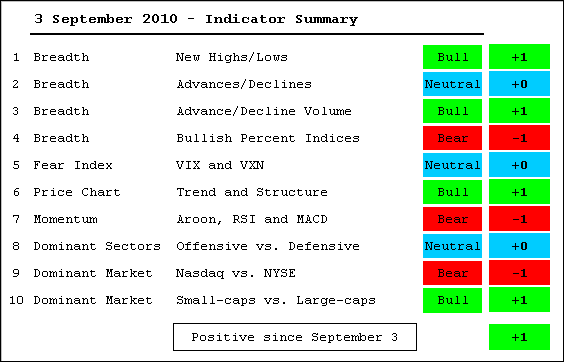
Big swings continue to whipsaw the indicator summary. The S&P 500 first closed below 1100 on May 20th. Since then the index has crossed the 1100 level at least nine times as the index trades within a large consolidation. There have been four swings of at least 8% since mid May (14 weeks). That is one 8% swing every 3.5 weeks. Needless to say, such swings are strong enough to move the indicators. With reversals every 3-4 weeks, the lagging indicator summary is getting whipsawed back and forth. Once again, the summary has moved from negative to positive. There are still many splits within the indicators though. For example, the NYSE AD Volume Line is considered bullish, but the Nasdaq AD Volume Line is considered neutral. Together, I classified them as bullish overall. This means the indicator summary is still prone to another flip should stocks swing sharply lower. Indicator details can be found after the jump.
- AD Lines: Neutral. The NYSE AD Line broke above channel resistance and remains strong overall (bullish). The Nasdaq AD Line has yet to reverse its downtrend (bearish).
- AD Volume Lines: Bullish. The NYSE AD Volume Line formed a higher high in early August and a higher low in late August (bullish). The Nasdaq AD Volume Line formed a lower high in early August and a higher low in late August (neutral).
- Net New Highs: Bullish. Nasdaq Net New Highs turned positive this week, but the cumulative Net New Highs line has been trending lower since mid May (neutral). NYSE Net New Highs remain positive overall and the cumulative Net New Highs line continues to rise (bullish).
- Bullish Percent Indices: Bearish. The major index BPIs are all below 50%. Five of the nine sector BPIs are below 50%. Energy, consumer staples, materials and utilities are at or above 50%.
- VIX/VXN: Neutral. The S&P 500 Volatility Index ($VIX) and Nasdaq 100 Volatility Index ($VXN) moved sharply lower the last eight days and remain largely flat since mid July.
- Trend Structure: Bullish. QQQQ, SPY and DIA formed higher lows and broke above channel resistance with big moves this week. IWM tested its July low and broke above channel resistance.
- SPY Momentum: Bearish. MACD(5,35,5) and Aroon (20) remain in negative territory, but RSI surged above 50.
- Offensive Sector Performance: Neutral. Consumer discretionary and industrials are showing some relative strength, but technology and finance show relative weakness overall.
- Nasdaq Performance: Bearish. The $COMPQ:$NYA ratio moved to a new reaction low in early September.
- Small-cap Performance: Bullish. The $RUT:$OEX ratio has been trending lower since April, but a small bullish divergence formed in August and the price relative surged the last two weeks.
- Breadth Charts have been updated (click here)

