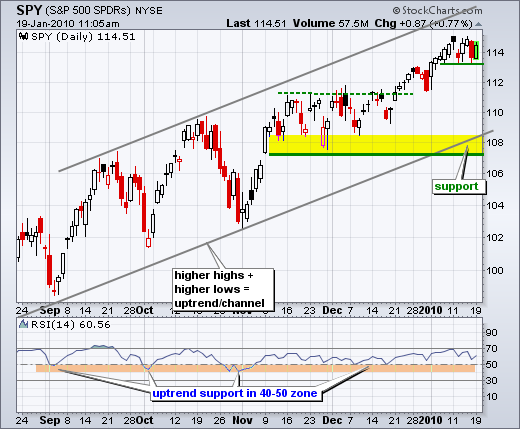
There is no change in the medium-term uptrend (daily chart). SPY is trading in the upper half of a rising price channel. Starting from around 103 in early November, the ETF broke resistance at 111 in late December and moved above 114 in early January. Even though SPY seems overextended after a 5% advance since late November, there is simply no sign of weakness. Declines have been limited to 1-2 days as buyers step in after the smallest pullback. There was some selling pressure last week with down days on Tuesday and Friday, but the ETF moved right back above 114 the very next day. Medium-term support remains at 107. Momentum support is set at 40 for RSI.


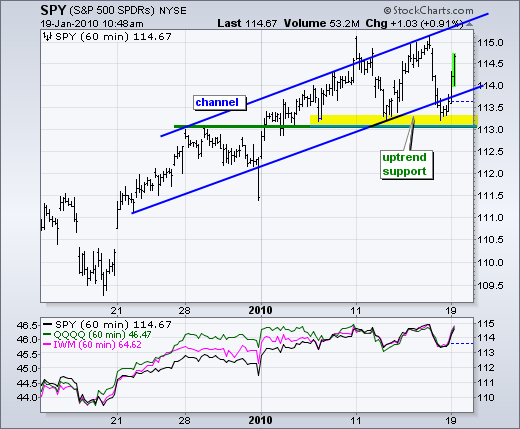
On the 60-minute chart, SPY declined to short-term support on Friday and bounced off support early Tuesday. Nothing like a post-holiday bounce. With three bounces off 113 in three weeks, support here is clear. I will respect the uptrend as long as this level holds and expect higher prices. Even though Friday's low broke below the channel trendline, I think this channel still serves as a rough trajectory for price action. The upper trendline extends to the 116 area later this week.


About the author:
Arthur Hill, CMT, is the Chief Technical Strategist at TrendInvestorPro.com. Focusing predominantly on US equities and ETFs, his systematic approach of identifying trend, finding signals within the trend, and setting key price levels has made him an esteemed market technician. Arthur has written articles for numerous financial publications including Barrons and Stocks & Commodities Magazine. In addition to his Chartered Market Technician (CMT) designation, he holds an MBA from the Cass Business School at City University in London.
Learn More