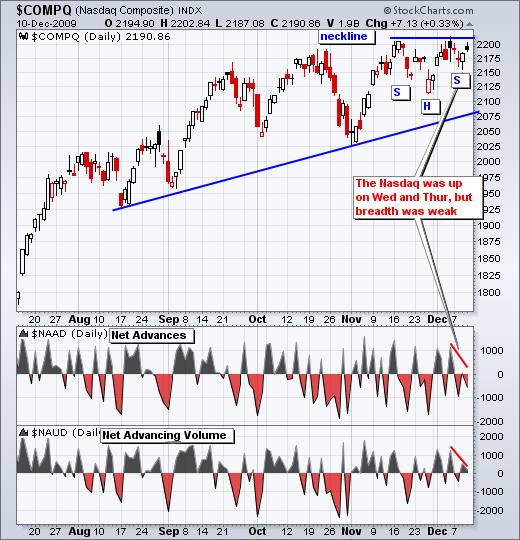
The Nasdaq moved higher the last two days, but Net Advances were barely positive on Wednesday and negative on Thursday. Net Advancing Volume was barely positive on both days. Even though the gains in the Nasdaq were small, weak breadth reflected narrow participation that could undermine the advance. On the price chart, the Nasdaq could be tracing out a small inverse head-and-shoulders pattern with neckline resistance around 2210. The pattern is not picture perfect, but the basic shape is there.


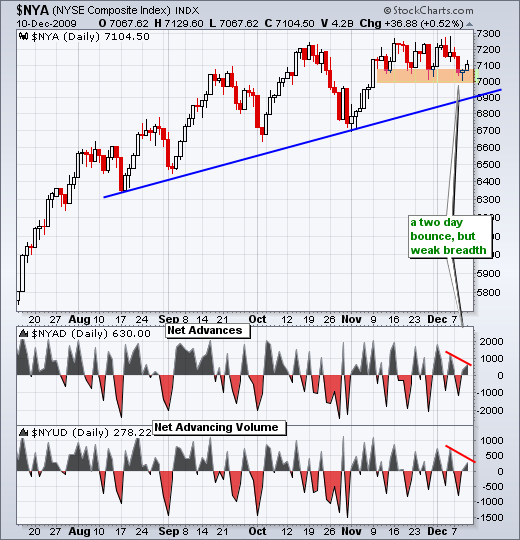
NYSE breadth was slightly better than Nasdaq breadth over the last two days, but still largely uninspiring. It should also be noted that the two day gain in the NY Composite (.68%) was less than the two day gain in the Nasdaq (.86%). Also notice that the NY Composite tested its late November low, but the Nasdaq held above its late November low (hence the right shoulder for the Nasdaq). Despite a feeble bounce, the bigger trend is up and support around 7000 is holding for the NY Composite.


About the author:
Arthur Hill, CMT, is the Chief Technical Strategist at TrendInvestorPro.com. Focusing predominantly on US equities and ETFs, his systematic approach of identifying trend, finding signals within the trend, and setting key price levels has made him an esteemed market technician. Arthur has written articles for numerous financial publications including Barrons and Stocks & Commodities Magazine. In addition to his Chartered Market Technician (CMT) designation, he holds an MBA from the Cass Business School at City University in London.
Learn More