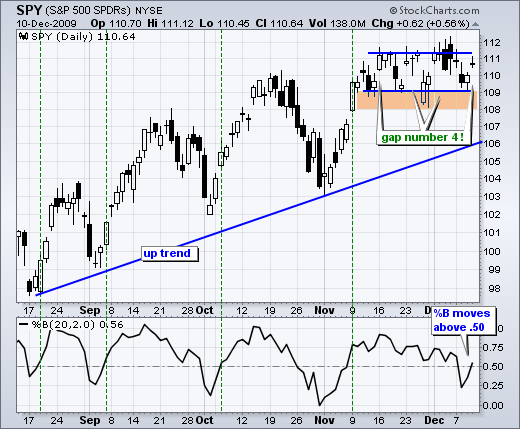
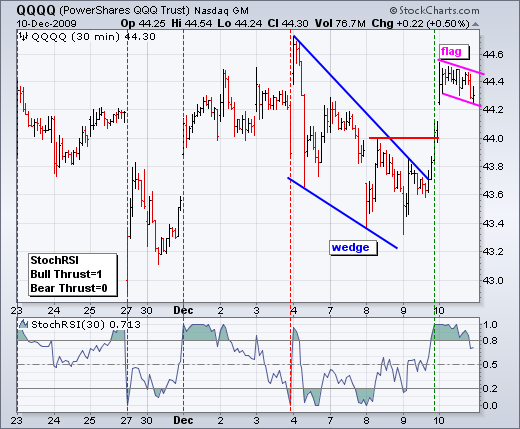
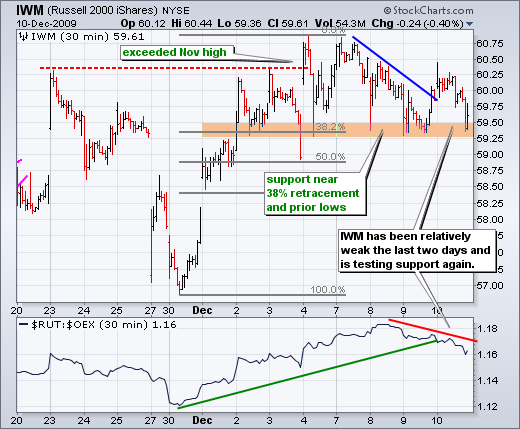
For the fourth time in five weeks, the S&P 500 ETF (SPY) held support with a gap up. Here's what we know. The medium-term trend is up, SPY is consolidating, support is holding and seasonality favors the bulls (especially from December 21st). Keep seasonality in mind, but keep the chart first and foremost. The blue lines mark the closing high and low of the last five weeks. SPY cannot seem to close above 111.5 or below 109. On a closing basis, these are the levels to watch for a range break.


The indicator window shows %B ((Close - Lower Band) / (Upper Band - Lower Band)). %B tells us where the close is relative to the Band Width (Upper Band - Lower Band). Readings above .50 indicate that the close is in the upper half of the band range, while readings below .50 show a close in the lower half. %B dipped below .50 earlier this week, but moved back above .50 this week. In general, the bulls have an edge when %B is above .50 and the bears have an edge when below -50. The green dotted lines show prior crosses above .50 (five from Aug to Dec). The November cross did not generate a great signal, but the others were pretty good.
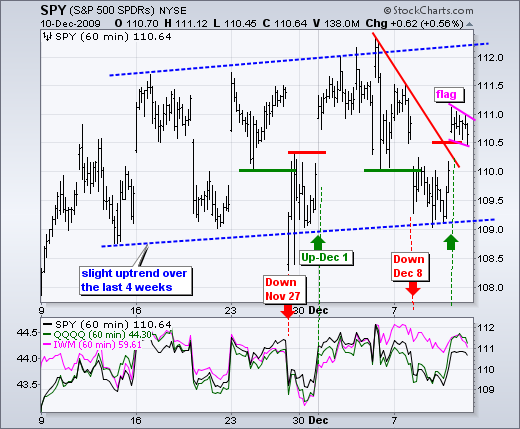
On the 60-minute chart, SPY broke above resistance at 110 to reverse the downswing within the trading range. As the blue dotted lines show, this trading range has a slight upward bias. After the morning gap-breakout, SPY consolidated with a falling flag of sorts. No follow through may seem bearish, but the morning gap-gains did hold and this is more bullish than bearish. With the consolidation looking like a small falling flag, a break above 111 would be the next bullish trigger that would target a move to resistance in the 111.5-112 area. Failure to follow through and a move back into the gap zone would be negative. Therefore, a move below 110.3 would call for a re-evaluation of this breakout.


On the 60-minute chart, SPY broke above resistance at 110 to reverse the downswing within the trading range. As the blue dotted lines show, this trading range has a slight upward bias. After the morning gap-breakout, SPY consolidated with a falling flag of sorts. No follow through may seem bearish, but the morning gap-gains did hold and this is more bullish than bearish. With the consolidation looking like a small falling flag, a break above 111 would be the next bullish trigger that would target a move to resistance in the 111.5-112 area. Failure to follow through and a move back into the gap zone would be negative. Therefore, a move below 110.3 would call for a re-evaluation of this breakout.


About the author:
Arthur Hill, CMT, is the Chief Technical Strategist at TrendInvestorPro.com. Focusing predominantly on US equities and ETFs, his systematic approach of identifying trend, finding signals within the trend, and setting key price levels has made him an esteemed market technician. Arthur has written articles for numerous financial publications including Barrons and Stocks & Commodities Magazine. In addition to his Chartered Market Technician (CMT) designation, he holds an MBA from the Cass Business School at City University in London.
Learn More