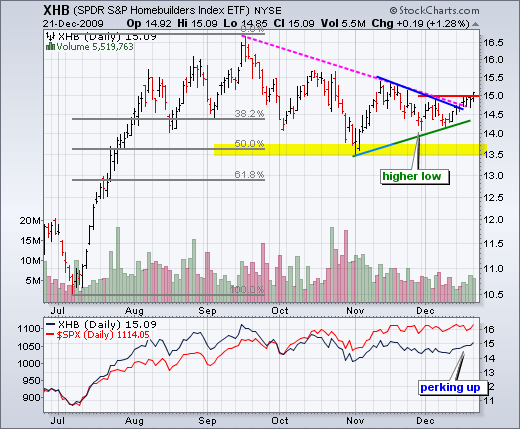
Homebuilding stocks will be in the spotlight with two upcoming reports. Existing Home Sales will be reported on Tuesday (10 AM ET) and New Home Sales will be released on Wednesday at 10 AM ET). The homebuilding ETFs have been lagging the broader market over the last three months, but their long-term chart patterns look promising. As far as I am concerned, the overall market remains in bull mode with SPY trading near a 52-week high. This means that bullish setups are still preferred over bearish setups. The first chart shows the Homebuilders SPDR (XHB) with a big surge from July to September. XHB then retraced 50% of this advance with a decline to around 13.5 in early November. Even though XHB is still underperforming the broader market since September, price action has picked up in recent weeks. Most recently, the ETF formed a higher low in late November and broke above the September trendline the last few days.


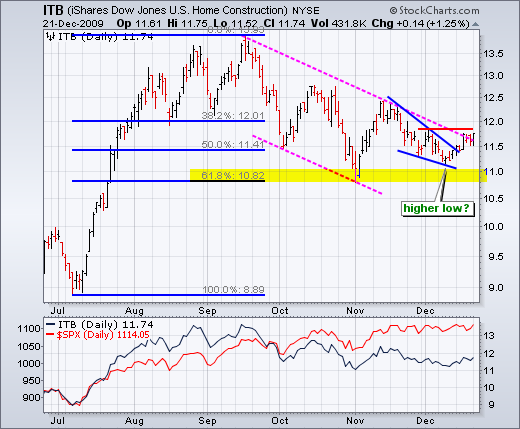
The second chart shows the Home Construction iShares (ITB) with similar characteristics. ITB surged in July-Sep, corrected in Sep-Nov and firmed the last few weeks. Notice that ITB retraced around 62% of its prior advance and formed a big falling channel over the last few months. This looks like a big advance and then a corrective move within a bigger uptrend. The ETF is currently challenging the channel trendline and resistance from the early December high.

*****************************************************************

About the author:
Arthur Hill, CMT, is the Chief Technical Strategist at TrendInvestorPro.com. Focusing predominantly on US equities and ETFs, his systematic approach of identifying trend, finding signals within the trend, and setting key price levels has made him an esteemed market technician. Arthur has written articles for numerous financial publications including Barrons and Stocks & Commodities Magazine. In addition to his Chartered Market Technician (CMT) designation, he holds an MBA from the Cass Business School at City University in London.
Learn More