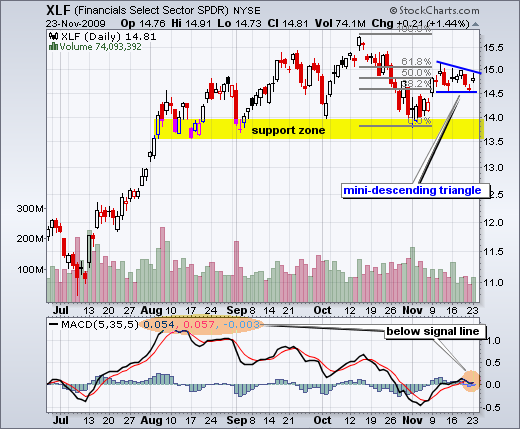
While the Dow and S&P 500 moved to new reaction highs in November, the Financials SPDR (XLF) remains well below its October high. XLF is clearly not keeping pace with the broader market. Such relative weakness can foreshadow absolute weakness and a potential break down. XLF surged above 15 the second week of November and then stalled the last two weeks. With a lower high last week, a mini descending triangle is taking shape.
Also notice that XLF is hitting resistance near the 62% retracement mark. A break below 14.5 would be short-term bearish and argue for a continuation of the October decline. Should XLF hold support, look for a break above 15 to trigger a bullish signal. The bottom indicator window shows MACD(5,35,5) moving below its signal line over the last few days.

