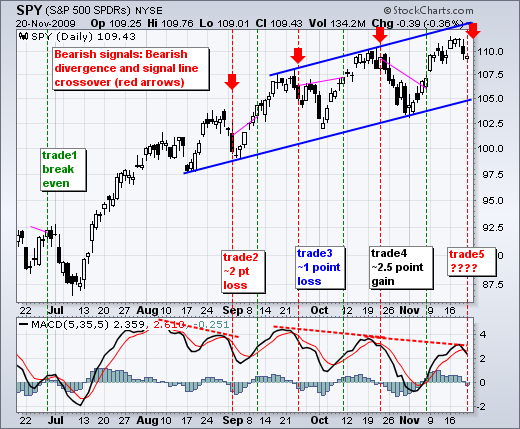
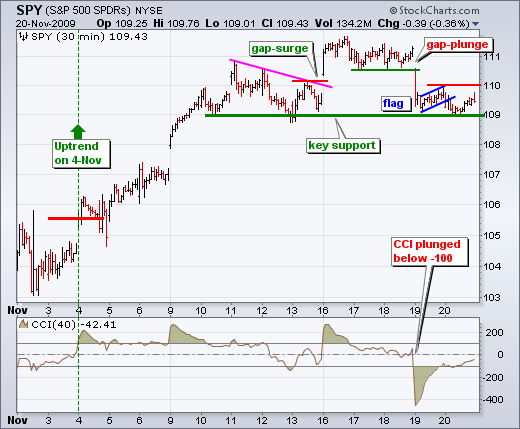
With a little weakness on Friday, SPY broke below flag support on the 30-minute chart and MACD(5,35,5) moved below its signal line on the daily chart. First, let's look at the daily chart. For the fifth time since June, MACD formed a bearish divergence and moved below its signal line. The last four trades are shown on the chart with mixed results. Despite this MACD crossover, keep in mind that the medium-term trend remains up as SPY works its way higher within a rising price channel. In addition, stocks have a habit of moving higher Thanksgiving week. According to the Stock Trader's Almanac, the Dow has a 61.9% chance of moving higher on Monday, Wednesday and Friday, and a 71.4% chance of moving higher on Tuesday.

The momentum oscillators are produced bearish signals on the charts, but SPY has yet to break support at 109 on the 30-minute chart. SPY broke flag support at 109.25 and then bounced off key support at 109. As far as the flag break is concerned, a move back above 110 would warrant a re-evaluation. A move below 109 would break key support and argue for a short-term trend reversal. As far as I am concerned, the ability to hold support at 109 is quite positive, especially heading into Thanksgiving week. It ain't broken until its broken.

There is a general pecking order for bearish signals and trader types. First, top pickers act during overbought conditions and at resistance. Top pickers would have been active around 111 last week - before an actual downturn. Second, early birds look for an intraday chart signals or momentum oscillator signals. Early birds would have focused on the flag support break and today's MACD break. Third, trend followers wait for a support break or some sort of confirmation. Trend followers are waiting for a break below key support at 109. All three have their advantages and disadvantages. The top pickers have the best risk-reward ratio, but the highest chance of failure. Trend followers have the worst risk-reward ratio, but usually a better chance of success. Early birds are somewhere in between. A fourth methodology can be used to capture the risk-reward ratio of top picking and the confirmation of trend following. After a support break at 109 and clean trend reversal, wait for an oversold bounce that retraces 50-62% of the first decline or hits a short-term resistance area. The confirmed trend reversal improves the odds of success. The oversold bounce improves the risk-reward ratio. In the current SPY situation, this would involve waiting for a clean support break at 109 and then an oversold bounce back towards 110.
