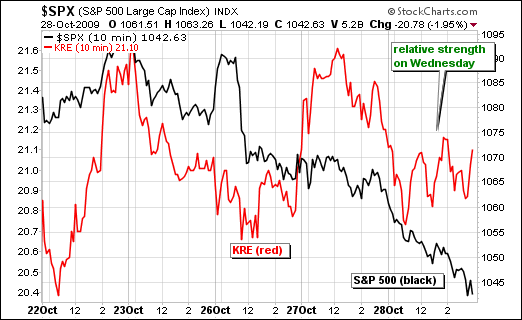
I was quite impressed with the ability of the Regional Bank SPDR (KRE) to firm over the last few days. The S&P 500 is down around 4.5% in four days and KRE is down only 2.3%. The first chart shows KRE and the S&P 500 over the last five days. Notice how the S&P 500 moved straight down (black). KRE also moved lower on Friday, but firmed on Monday and held above Monday's lows over the last two days. This shows relative strength.
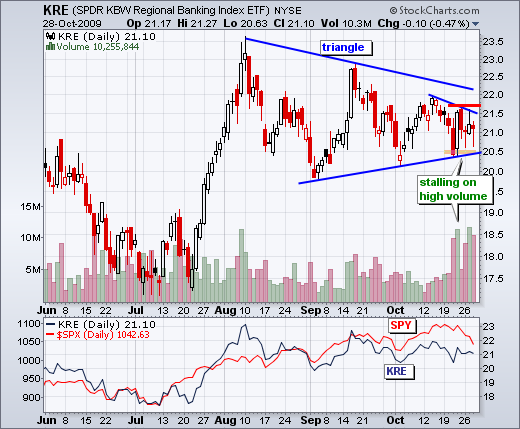
The second chart shows daily candlesticks with a large triangle forming. The ETF held support with three indecisive candlesticks this week. Volume remains high as the ETF churns in the 20.5-21.5 area. I already have a bullish bias after last week's long white candlestick on high volume. This candlestick affirmed support and shows strong buying interest. A break above Friday's high would trigger a breakout.


