After a 5% decline from the October high, the S&P 500 ETF (SPY) surged back above 106 on Thursday. Is this just a dead-cat bounce or should we expect more strength? Technically, the medium-term trend is still up. As such, a number of mean-reversion strategies turned bullish after Wednesday's close.
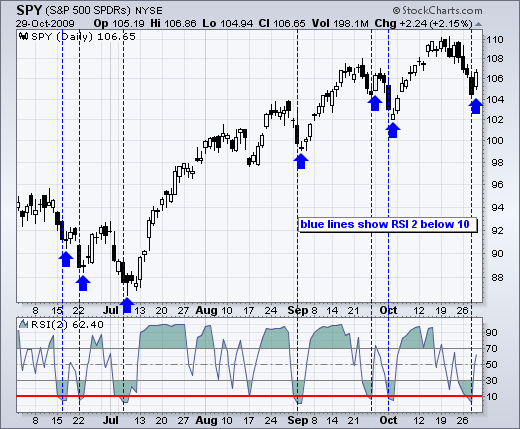
In a medium-term uptrend, a mean-reversion strategy turns bullish with short-term oversold conditions. One example would be turning bullish when 2-period RSI moves below 10. After RSI moves below 10, traders would then buy on the next open (blue arrows). As you can see, this strategy produced some good signals since June. There were, however, a couple bad signals or whipsaws. This strategy works great as long as the uptrend continues. Trouble starts with extended corrections (June-July) or when the uptrend reverses. Even though this oversold bounce could extend one or two points further, I think we are in danger of medium-term uptrend reversal at this stage. More details are provided a later blog post.
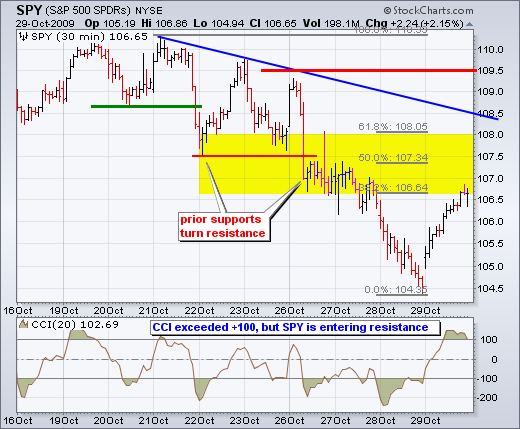
On the 30-minute chart, SPY is entering the bottom of its resistance zone. After a decline from 110 to 104.5, the ETF became short-term oversold. On the daily and 60-minute charts yesterday, I outlined the reasons to expect support around 105. Even though support held and the medium-term trend remains up, the ETF is already entering its short-term resistance zone on the 30-minute chart. The 38-62% retracements, broken supports and the consolidation around 107 mark resistance here. As such, I expect some trouble in this zone and remain short-term bearish.


