-Bulls Still Dominate
-A Close-Only View of QQQQ
-SPY Stalls around 100
-Short-term Momentum Deteriorates
-Breadth Remains Bullish Overall
-VIX Shows Short-term Abnormality
-Dollar Reinforces Resistance
-Gold Holds Support and Dollar Falls
-Bonds Bounce off Support After Fed
-Stocks: LMT, PFCB, RIMM
-Click here for today's video.
-Vacation for the next two weeks.
-Next update will be September 1st (Tuesday) by 7AM ET.
*****************************************************************
See a chart you like or want to duplicate? Each chart image contains a link to the original SharpChart. Users can click on the chart to see the indicator settings and save the chart to their favorites list.
*****************************************************************
Bulls Still Dominate Stocks
The bulk of the medium-term evidence remains bullish for the stock market. The major stock indices are in clear uptrends. Key sectors and industry groups are participating. Breadth is bullish overall. All bullish percent indices are well above 50%. The volatility indices are trending lower. Bullish sentiment is creeping higher as the AAII bulls reached 51%, but 33% are still bearish. As such, I am not too concerned with this sentiment number just yet.
In general, I am focusing on two trends. The medium-term trend focuses on the March-August advance, while the short-term trend focuses on the July-August advance. Both trends are up. However, this short-term uptrend is loosing momentum after becoming overbought in early August. A break below short-term support levels would argue for a pullback within the medium-term uptrends.
*****************************************************************
Close Only View for QQQQ
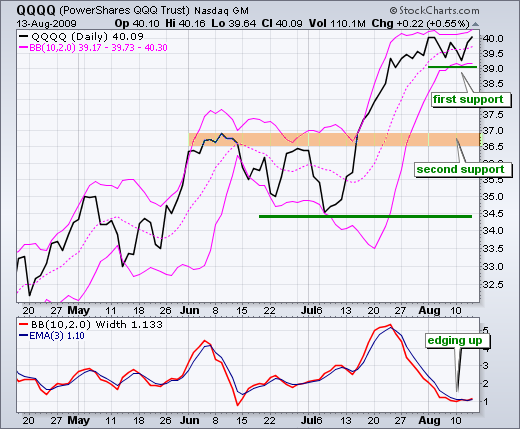
I am starting with a close-only chart for QQQQ. While I generally prefer bar and candlestick charts, we should also keep in mind that most indicators are based on closing prices (RSI, Bollinger, MACD et al). QQQQ surged from 34.5 to 40 in July and then traded flat in August. In yesterday's market message, I argued that QQQQ has been trading flat since July 23rd. However, a close-only view shows flat trading since August. In any case, the trend remains up, regardless of how long QQQQ has been trading flat. The prior move was clearly up and flat trading does not reverse an uptrend. It is simply a rest along the way. The Bollinger Bands (10,2) have been overlaid as a short-term indicator (two weeks). Even though these bands are at their narrowest since mid June, QQQQ has yet to actually break down. I am marking closing support at 39. A close below this level would be short-term bearish and argue for a correction of the July surge. We should expect higher prices until first support is broken.
*****************************************************************
SPY Stalls Around 100
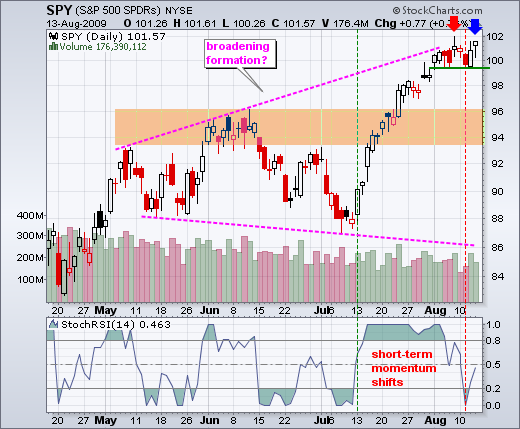
I will move back to the candlestick chart for SPY. Candlestick action is hinting at a short-term reversal, but we have yet to see confirmation with a support break. An indecisive spinning top formed last week as the ETF touched 102 (red arrow). A long red candlestick followed the spinning top two days later. However, support held as the ETF bounced back with a big gain on Wednesday - only to form a hanging man yesterday. While these bearish candlesticks are certainly teasing the bears out there, they lack confirmation with a support break. Also keep in mind that the medium-term trend is up. Calling short-term reversals within medium-term uptrends is a difficult proposition. Moreover, a short-term downtrend would be viewed as a correction or pullback within a bigger uptrend. Should SPY break support at 99.4, the downside target would be the 94-96 area.
There are also short-term signs of a momentum shift. The bottom indicator window shows StochRSI (14). This indicator is basically RSI on steroids. It is very sensitive and prone to whipsaw. The decline below .50 over the last few days is negative for momentum. This also coincides with a move below 50 in RSI on the 60-minute chart. A loss of momentum often precedes a short-term trend reversal.
*****************************************************************
Short-term Uptrends with Waning Momentum
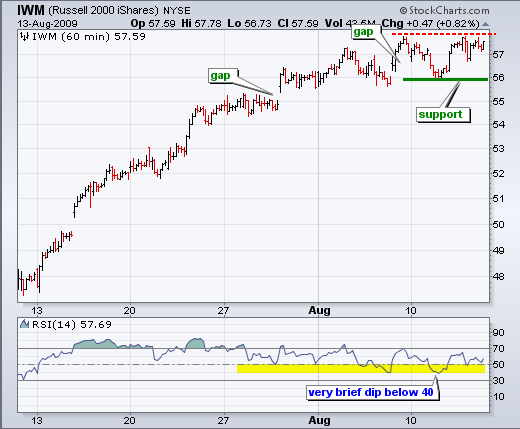
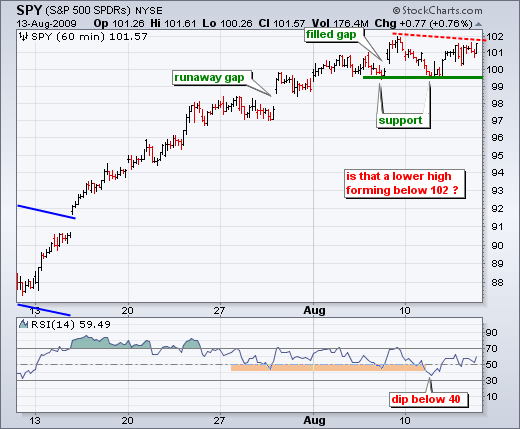
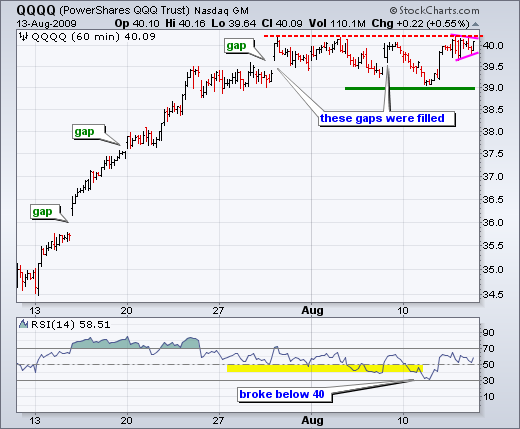
The 60-minute charts confirm weakening short-term momentum as RSI dipped below 40 for SPY, IWM and QQQQ. The dip below 40 in RSI for IWM was ever so brief though. In addition, IWM and SPY held support levels from last week's lows. QQQQ broke below last week's low, but recovered with a sharp surge on Wednesday. All three consolidated near last week's highs on Thursday. Now what? With two out of three holding above last week's lows, the short-term trends remain up overall. I am concerned with RSI breaking below 40 for all three, but confirmation from the price chart has yet to happen. Price is the final arbiter here. Indicators are derivatives of price, which means they are at least one step removed from price. At this stage, I am waiting for support breaks in all three to signal a short-term trend reversal that would argue for a correction of the July-August advance. Until said support break, higher prices are more probable as a trend in motion stays in motion.
*****************************************************************
Key Indicators Remain Medium-term Bullish
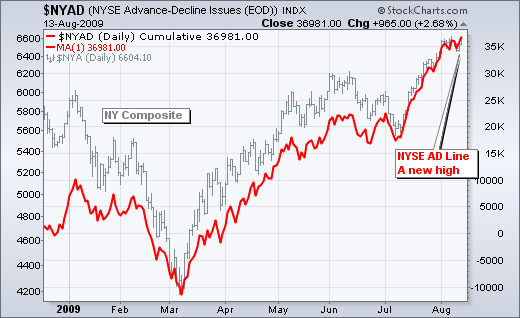
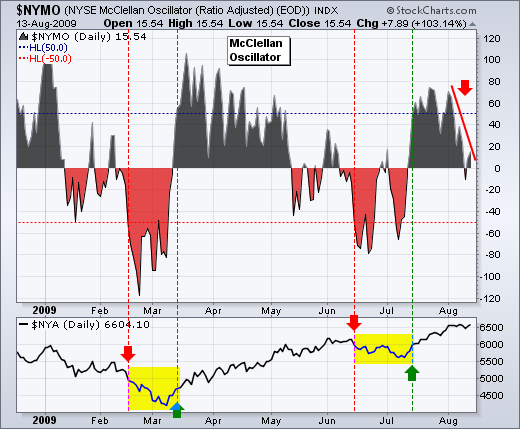
Breadth indicators remain medium-term bullish. The NYSE AD Line, NYSE AD Volume Line and Nasdaq AD Volume Line all moved to new highs this week. The Nasdaq AD Line has yet to exceed last week's high. This is a small discrepancy. The charts below show the NYSE AD Line and the NYSE McClellan Oscillator. As with RSI and MACD, the McClellan Oscillator is an indicator that is a derivative of net advances (advances less declines). For review, the McClellan Oscillator is the 19-EMA of Net Advances less the 39-day EMA of Net Advances. Notice that the AD Line moved to a new high this week. The indicator moved straight up in July and then zigzagged higher in August. This little zigzag caused a loss in upside momentum for the AD Volume Line, which is reflected in the McClellan Oscillator. The oscillator moved above +50 on July 15th and held strong throughout July. As the AD Line zigzagged in August, the McClellan Oscillator moved lower and even crossed into negative territory. Again, this is just a short-term negative that reflects a more divided market. We have yet to see enough selling pressure to turn medium-term bearish. At the very least, the McClellan Oscillators would need to plunge below -50 to consider turning bearish.
*****************************************************************
VIX Stalls With the S&P 500
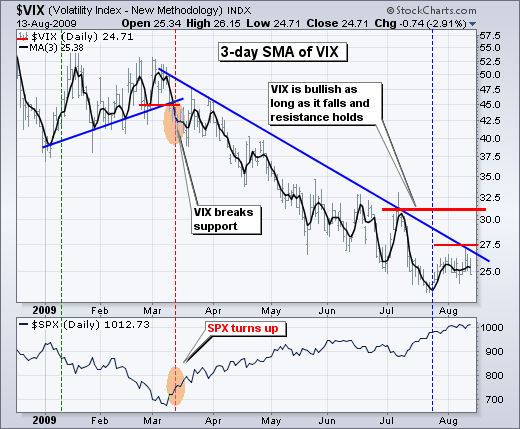
The S&P 500 Volatility Index ($VIX) and Nasdaq 100 Volatility Index ($VXN) remain in medium-term downtrends (March to August). These downtrends affirm the corresponding uptrends in the S&P 500 and Nasdaq 100. It would take a break above the late July highs to reverse these downtrends and turn these indicators negative for stocks.
Despite medium-term downtrends, I continue to see abnormal price action in the VIX and VXN short-term. While the S&P 500 moved higher from July 24th to August 13th, the VIX moved lower over this same timeframe. Normally, the VIX moves lower as the S&P 500 moves higher. This abnormality warrants short-term attention. Further strength with a break above 27.5 in the VIX would be short-term bearish for stocks. This would not be enough to reverse the medium-term trends, but it could be enough to trigger a correction in the stock market.
*****************************************************************
Dollar Establishes Resistance
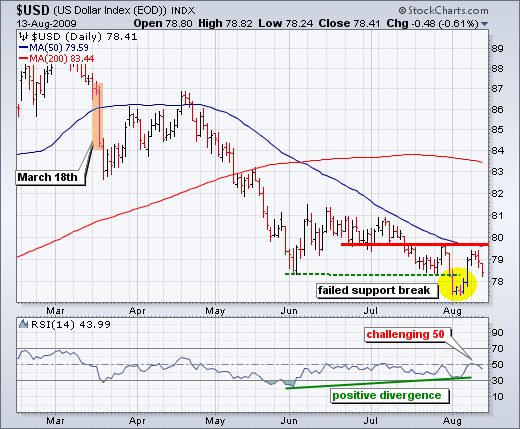
With the Fed ending its $300 billion bond purchase program in October, the US Dollar Index ($USD) will be in the spotlight over the next few weeks. The Dollar fell sharply when the Fed announced the program on March 18th. After the Fed announcement on Wednesday, the Dollar fell on Thursday and did not react well to this "positive" news. The overall trend remains down for the greenback with resistance just below 80. A move above 80 would break the late July high and the 50-day SMA. In addition, I would also look for RSI to break above 60 to turn momentum firmly bullish. Both events would be enough to reverse the Dollar downtrend. Let's see it happen first.
*****************************************************************
Gold Holds Support
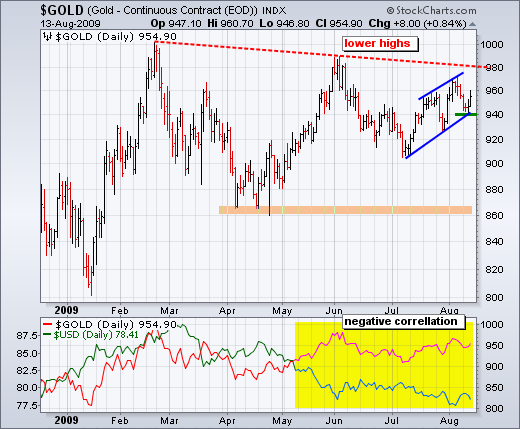
Bullion bugs have an obvious interest in what happens with the Dollar. A breakout in the Dollar would be negative for gold. Right now, the Dollar has yet to breakout and gold is holding its rising channel. The Gold-Continuous Futures ($GOLD) bounced off channel support on Thursday as the Dollar fell. With support at 940 reinforced, a break below this level would reverse the five week uptrend and signal a continuation of the June decline. This would target a move towards support in the low 860s.
*****************************************************************
Bonds: The Crazy Trade
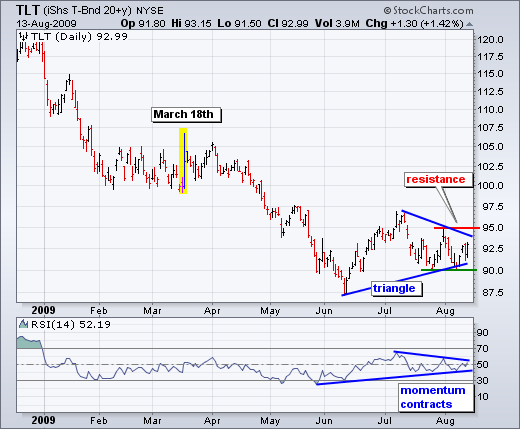
What's the craziest trade you can think of right now? I bet a lot of people would suggest buying bonds. The Fed is stopping its bond purchase program, the Treasury is issuing record amounts of debt and the economy showing signs of improvement. I cannot argue with the fundamentals. In addition, the current trend in the 20+ Year Treasury ETF (TLT) remains down. However, TLT may be forming a higher low as the ETF surged off 90 over the last four days. Follow though with a break above 95 would be technically bullish for bonds - despite the fundamentals.
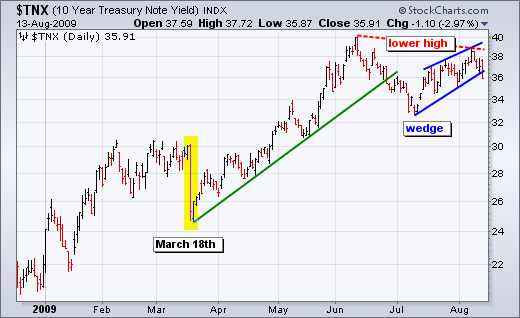
The second chart shows the 10-Year Treasury Yield ($TNX) breaking wedge support with a sharp decline on Thursday. Also notice that a lower high is taking shape in August. Rates have been rising all year. Even after the March 18th plunge, rates moved immediately higher.
*****************************************************************
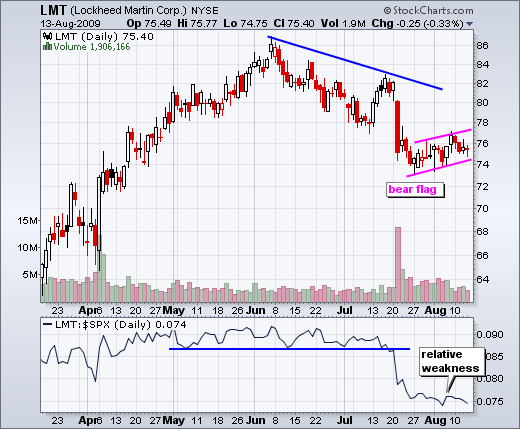
Lockheed Martin (LMT) forms a bearish flag and continues to show relative weakness. A break below 74 would signal a continuation lower.
*****************************************************************
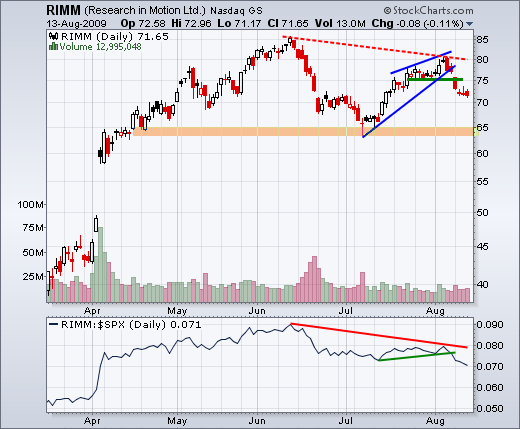
Research in Motion (RIMM) formed a lower high in August and broke support with a sharp decline. Also notice that the stock shows relative weakness as the price relative broke to new lows. Next support resides around 64-65.
*****************************************************************
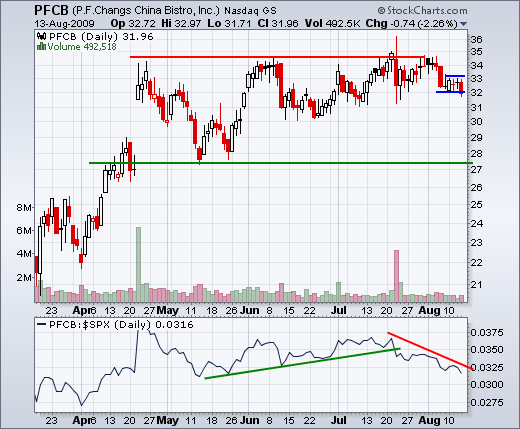
PF Changs (PFCB) shows relative weakness. The stock failed to take out resistance and declined sharply last week. Even with the market bounce over the last two days, the stock was weak and the price relative moved lower the last four weeks.
*****************************************************************

