-A Trend in Motion Stays in Motion
-High/Low Range Narrows for SPY
-QQQQ Volatility Contracts Further
-Short-term Uptrends Remain In Place
-XLY Forms Inside Day
-OIH Forges Island Reversal
-IGN Stalls at Resistance
-SMH Declines Five Days Straight
-Stocks Covered: AAPL, ARO, AVY, CHRW, DYN
-Click here for today's video.
-Next update will be Friday (August 14) by 7AM
ET.
-AAPL Forms Tight Consolidation
-ARO Channels Lower
-AVY Forms Bear Flag/Wedge
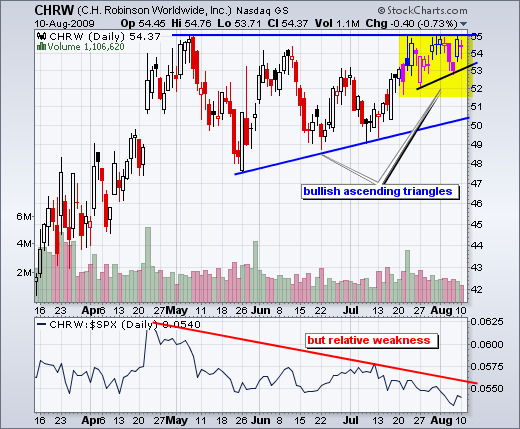
-CHRW Forms Two Ascending Triangles
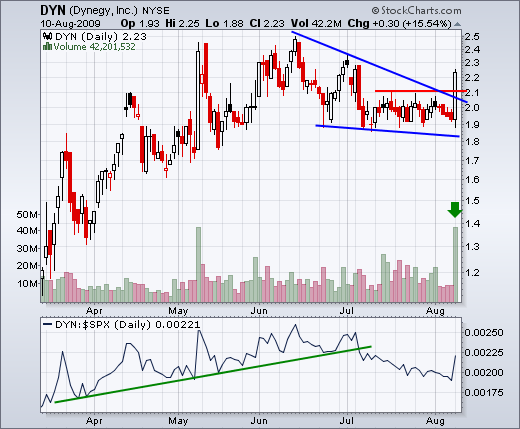
-DYN Surges on Big Volume
*****************************************************************
Go with the Mo
A trend in motion stays in motion. Even though the current uptrends are overextended, the major index ETFs remain in clear uptrends, on both the daily and 60-minute charts. According to Dow Theory, neither the length nor the duration of a trend can be forecast. The best we can do is to identify the trend (up) and accept it until proven other wise. The daily chart captures the medium-term trend, while the 60-minute charts capture the short-term trend. I am seeing indecision on the daily charts as volatility contracts and the daily range narrows. This can foreshadow a short-term trend reversal that could lead to a correction or pullback. Watch key supports and RSI on the 60-minute charts for clues.
*****************************************************************
The 24th Day
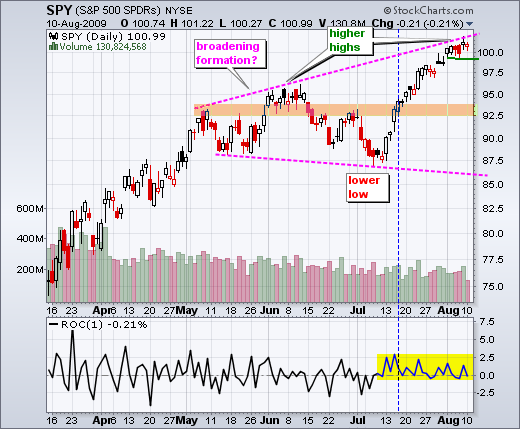
Since July 8th (24 trading days), the daily Rate-of-Change indicator has not dipped below .55 percent (yellow area). On a closing basis, the S&P 500 has not declined more than .55 percent since July 8th. There were a few days when the ETF was on the verge of loosing more than 1% on the day, but a late surge saved the day. SPY has not seen any significant selling pressure since early July. Even during the April advance the ETF experienced a few sharp declines. This remarkable July-August run has yet to stumble and the bulls remain in control.
Despite a clear uptrend, I remain concerned with three things. First, the index is overbought. Second, yesterday's high-low range was the narrowest in 16 days. This range contraction reflects indecision that could lead to a reversal. Third, a broadening formation could be taking shape. These items, however, are all subjective. From a truly objective perspective, the trend is up and there is no evidence of weakness on the price chart. Expect more strength until a bearish signal is actually triggered. At the very least, a break below last week's low is needed to signal the start of a pullback or correction.
*****************************************************************
QQQQ Extends Volatility Contraction
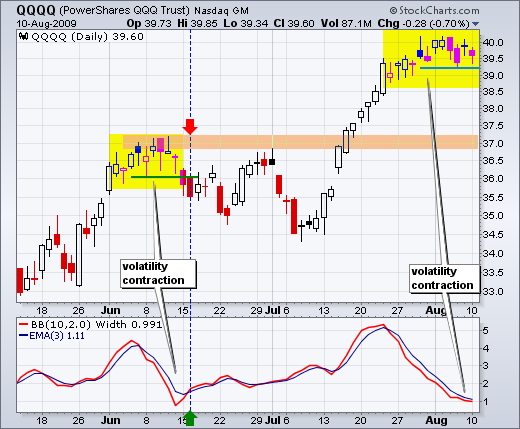
After a 10-day surge to 39.5, the Nasdaq 100 ETF (QQQQ) stalled as volatility contracted (yellow area). QQQQ first touched 39.5 on July 23rd and closed at 39.6 on August 10th (12 days later). As a result of this volatility contraction, Bollinger Band Width moved below 1 for the first time since mid June. While a volatility contraction shows indecision that can lead to a reversal, we have yet to see an actual breakdown on the daily chart. Sounds like the SPY situation. There were two down days last Wednesday-Thursday, a weak rebound on Friday and some weakness on Monday, but no break down. I am looking for two things to signal the start of a correction. First, a break below last week's lows. Second, an upturn in Bollinger Band Width with a move above the 3-day EMA. This is the same signal that started the June-July correction. Until we get this signal, the trend remains up and further gains are probable.
*****************************************************************
QQQQ Lagging, But at Support
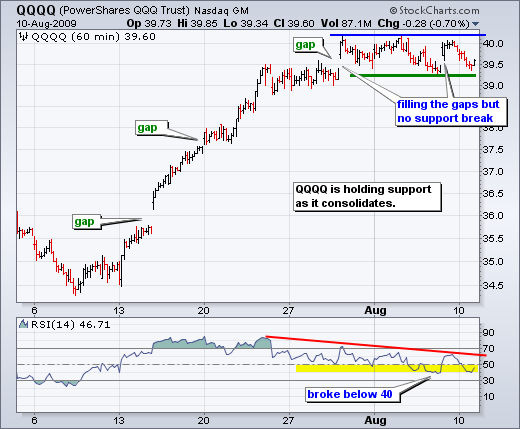
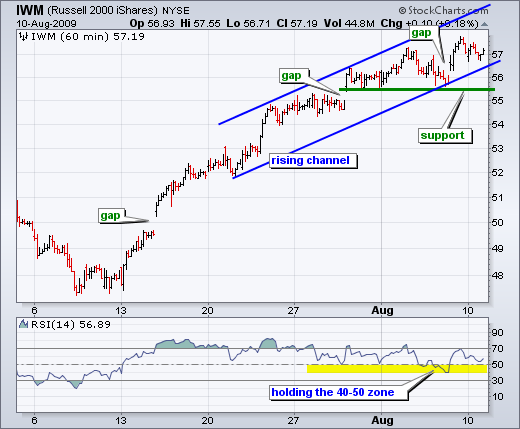
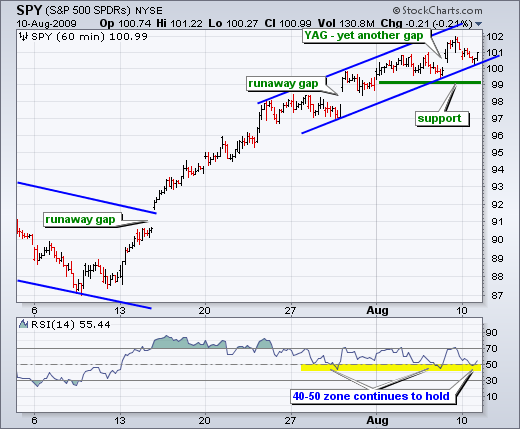
On the 60-minute charts, SPY and IWM remain in clear uptrends with rising price channels. QQQQ, however, have been trading flat since late August by forming a flat consolidation. With SPY-IWM trending up and QQQQ flat, QQQQ shows relative weakness by not keeping pace. This is potentially negative, but we have yet to see support breaks that would trigger trend reversals across the board. Moreover, IWM and SPY forged higher highs just last week. QQQQ looks the most vulnerable as it trades near its make or break point (support). Despite relative weakness and flat trading, the bulls still have the edge as long as support holds.
I need to loosen the support band for RSI. While 50 is technically "the" level to watch for momentum shifts, reality dictates the use of support and resistance zones. RSI held the 40-50 zone for SPY and IWM, but dipped below 40 for QQQQ. This confirms relative weakness in QQQQ. You can also see that SPY-IWM held above their prior lows and within their rising channels when RSI moved into the 40-50 zone. Look for all three to break support the price charts and RSI to break below 40 to reverse the current uptrends.
*****************************************************************
XLY Forms Inside Day
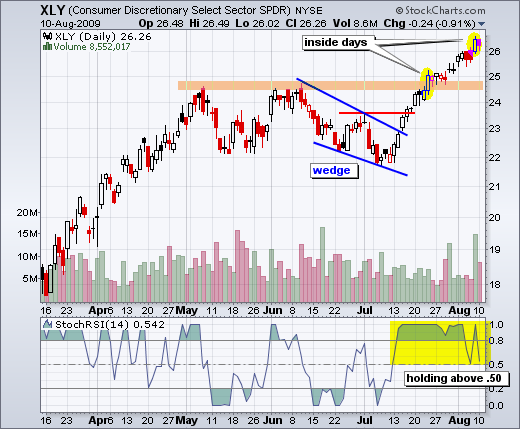
The Consumer Discretionary SPDR (XLY) formed a harami or inside day on Monday. This means that trading was within the prior day's range. This last occurred on July 24th and led to another three days of flat trading. It did not mark a reversal. Inside days show indecision that can foreshadow a short-term reversal. For indicators, I am watching for a move below .50 in StochRSI. This could start a correction/pullback towards broken resistance.
*****************************************************************
SMH Declines on High Volume
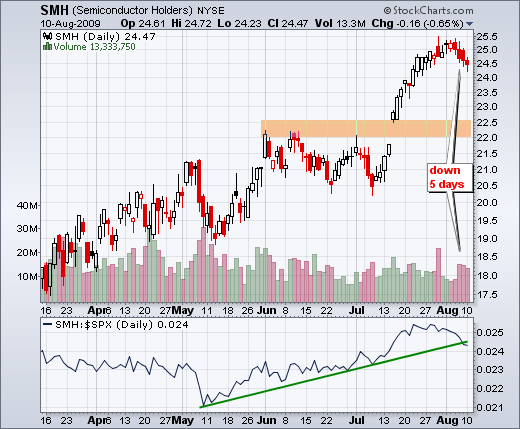
The Semiconductors HOLDRS (SMH) is now down five days straight with volume running above average the last three days. This is a clear show of relative weakness in a key technology group.
*****************************************************************
IGN Shows Relative Weakness
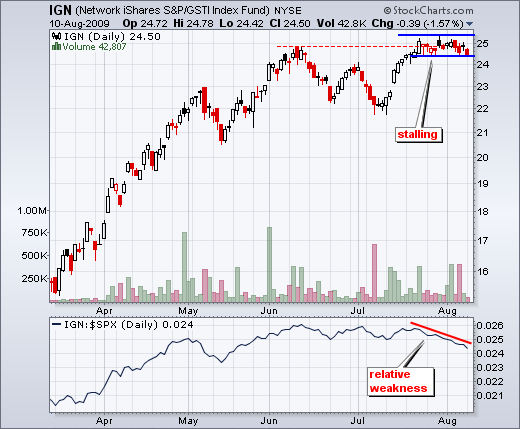
The Networking iShares (IGN) closed above 25 on July 23rd and then stalled the last 12 days. So far, this looks like a consolidation at resistance. Technically, an upside breakout would be bullish and signal a continuation lower. However, I would be concerned with relative weakness as the price relative moved lower the last three weeks. A support break would be short-term bearish for this key technology group.
*****************************************************************
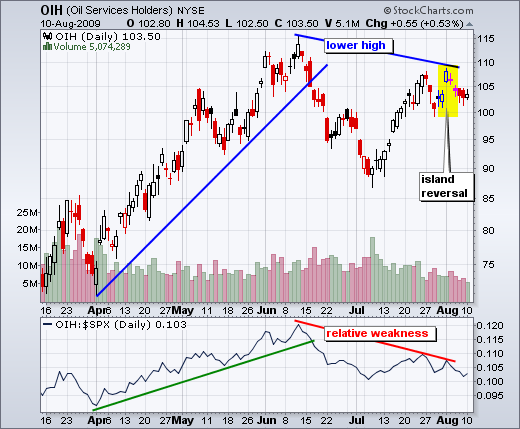
OIH Remains With Island Reversal
The Oil Service HOLDRs (OIH) forged an island reversal with a gap down last week. There are three parts to an island reversal: a gap up, trading above the gap and a gap down. The trading above the gap up creates the island. The gap down is below the low of this trading area (island). As a result, traders with long positions on the island are trapped with losses. The gap down is bearish as long as it remains unfilled.
*****************************************************************
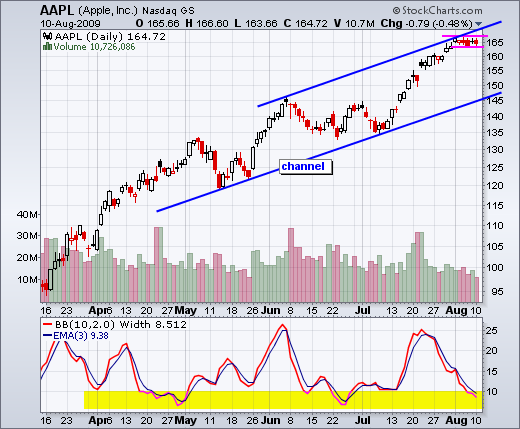
AAPL Forms Tight Consolidation
Apple Inc (AAPL) hit the top of its rising channel and stalled the last five days. A drew the lower trendline first and then the upper trendline parallel. The stock became overbought and stalled. A break below consolidation support would call for a correction or pullback. As the biggest component in QQQQ, we should watch Apple closely.
*****************************************************************
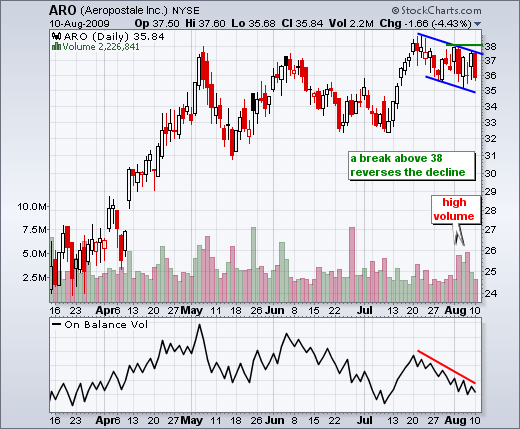
ARO Remains With Falling Channel
*****************************************************************
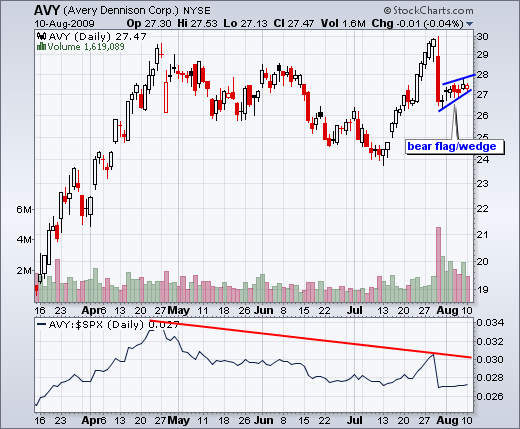
AVY Forms Bearish Flag/Wedge
*****************************************************************
Ascending Triangles for CHRW
*****************************************************************
Big Move for Dynegy
*****************************************************************

