Charts featured: SPY, DIA, GRMN, HOG, PFCB, FITB, HCBK, JPM, LAZ, MMC, USB, WFC, AMAT, NVDA, TIBX.
- Click here for today's video.
- Next update will be Tuesday (June 30) by 9AM ET.
*****************************************************************
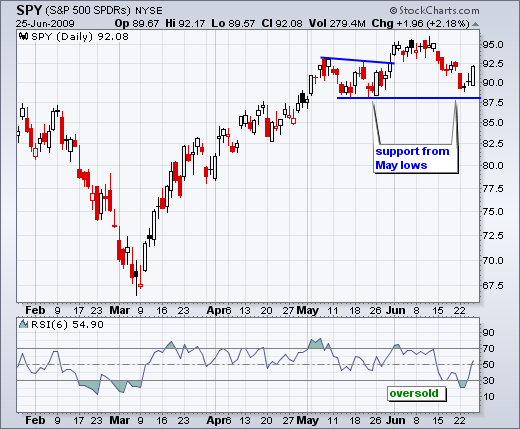
Trading remains tricky as we approach the end of the second quarter. There is evidence that a medium-term trend change is underway, but the major index ETFs can still be subject to oversold bounces. For instance, the Dow Diamonds (DIA) and S&P 500 ETF (SPY) were oversold and near support earlier this week. The first chart shows SPY firming just above the May lows with two doji this week (Tues-Wed). 6-period RSI also moved below 30 for the first time since March. Being oversold and at support provided the impetus for a bounce.
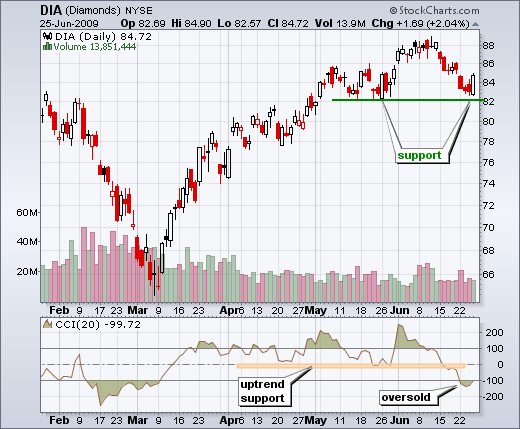
The next chart shows the Dow Diamonds (DIA) with a similar setup: oversold and at support. The ETF formed a bullish engulfing on Thursday, but low volume detracts from this bounce. Let's see some follow through before taking this bounce serious. Frankly, I think the bearish evidence presented in Tuesday's commentary still holds sway for the medium-term. A short-term oversold bounce is possible. Should a bounce unfold, I will be watching volume, breadth, sector participation and intermarket rotations to determine its sustainability.
There are two non-technical reasons for yesterday's bounce as well. First, the Fed made its policy statement on Wednesday to remove an unknown for Thursday. This makes it a sigh-of-relief bounce. Second, the second quarter is drawing to an end and this may have prompted some window dressing from fund mangers. Whatever the reason, the May lows held so far this week and we have yet to see lower lows in SPY or DIA.
*****************************************************************
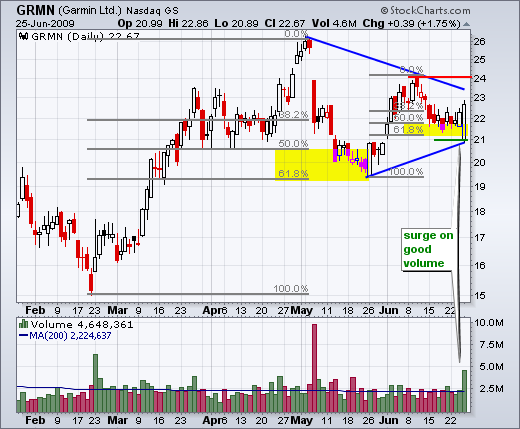
Garmin (GRMN) showed signs of life on Thursday with a big recovery on high volume. The stock surged from late February to early May and then retraced 50-62% with a sharp decline. After a strong surge off the May lows, the stock again pulled back with a 50-62% retracement. On Thursday, GRMN opened around 21 and then recovered to close above 22.50. High volume further reinforces this recovery and a break above 24 would argue for a continuation of the Feb-May advance.
*****************************************************************
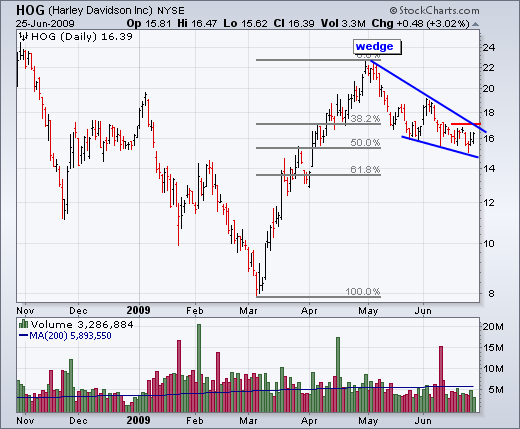
Harley Davidson (HOG) is tracing out a falling wedge over the two months. As the chart now stands, the trend is down and the stock shows relative weakness. However, falling wedges can represent mere corrections within a bigger uptrend. The stock is trying to firm around 16 and I am marking first resistance at 17. Look for a break above this level to break the falling wedge.
*****************************************************************
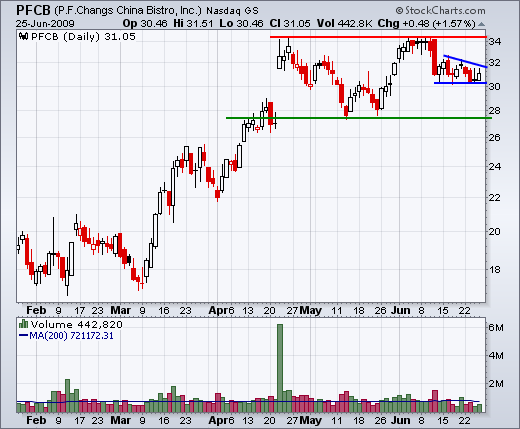
PF Changs (PFCB) is showing signs of selling pressure with a sharp decline from resistance. The stock declined from resistance at 34 with a long red candlestick on above average volume. A small descending triangle has taken shape over the last two weeks and a break below 30 would argue for further weakness.
*****************************************************************
The next group of stocks comes from the finance sector. After big advances from March to May, many banking stocks edged lower with slight declines. Traders and investors appear to be holding their breadth and waiting for the next announcement. Another all clear would be bullish and likely trigger some breakouts. A warning would be bearish and argue for an acceleration of the two month downtrend. Many stocks are finding support near the May lows or still trading near their May lows.
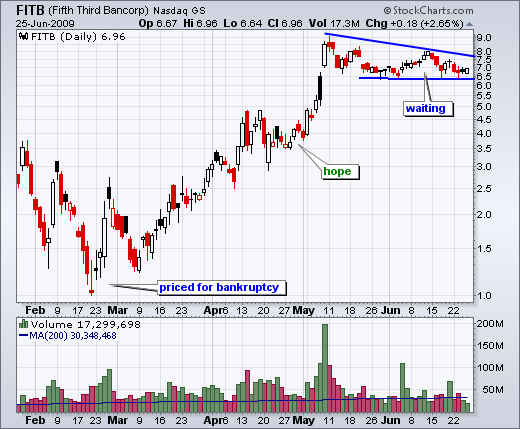
Fifth Third Bancorp (FITB) was priced for bankruptcy in February, but recovered with a big dose of hope in March-April. The waiting game began in May as the stock started a trading range. Look for a break above 8 to signal a continuation higher.
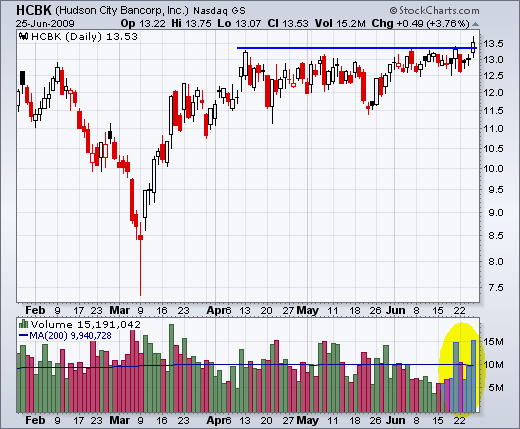
Hudson City Bancorp (HCBK) shows some relative strength with a break above its April-June highs on Thursday. Also notice that the stock surged with good volume over the last four days.
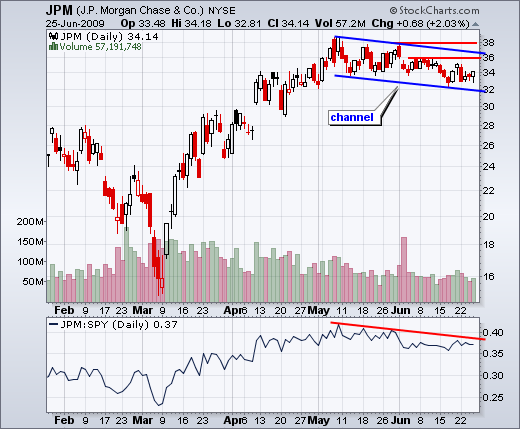
JP Morgan Chase (JPM) was featured in Wednesday's market message. The stock remains in a downtrend over the last seven weeks with a falling price channel. JPM broke the May lows last week, but managed to firm over the last few days. Even so, we have yet to see a surge that would signal the end of this seven week downtrend. At the very least, a move above 36 is needed show some buying pressure.
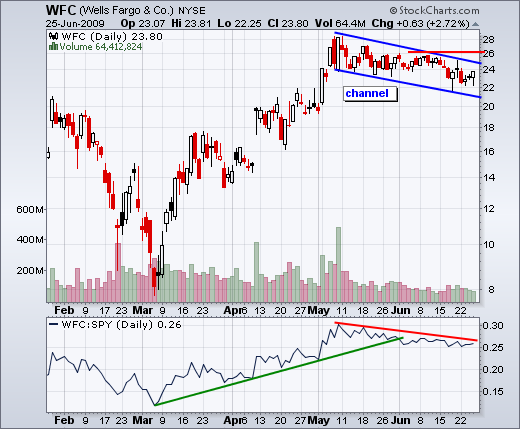
Wells Fargo (WFC) sports a similar pattern with channel trendline resistance at 25 and resistance from the June highs at 26.
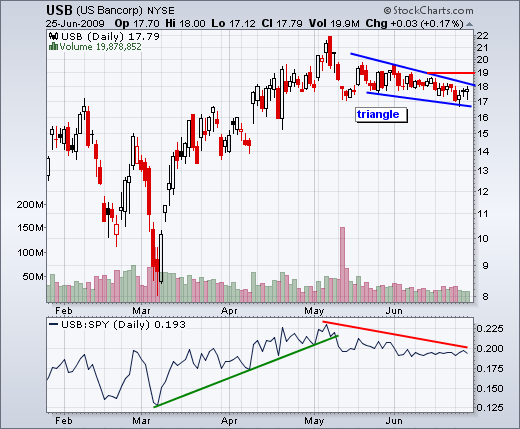
US Bancorp (USB) has been edging lower the last six weeks with a rather narrow range. The trend is currently down. Look for a move above 19 to reverse the fall.
*****************************************************************
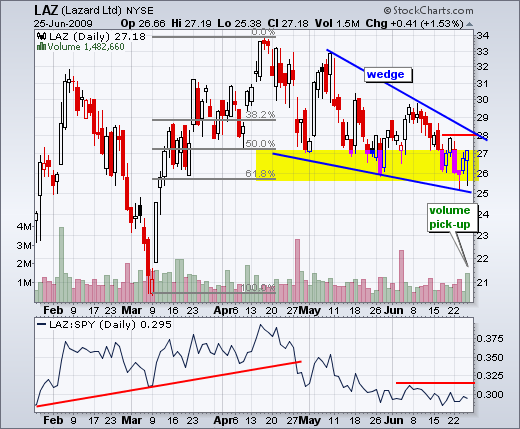
Lazard (LAZ) is also part of the finance sector, but it is not a bank per se. All the same, it is not completely immune to troubles in the finance sector. The stock peaked around 57 in February 2007 and bottomed around 20 in November 2008. It has never flirted with bankruptcy levels though. After a surge with the market in March-April, the stock declined back to 26 with a 62% retracement. Also notice that a falling wedge formed. The stock is showing signs of firmness with a high volume bounce on Thursday. Look for follow through above wedge resistance to reverse the downtrend.
*****************************************************************
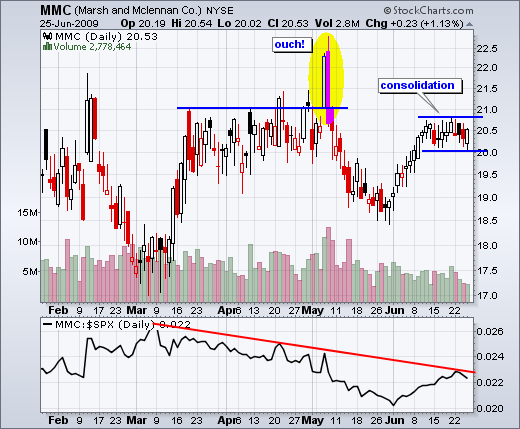
Marsh and McLennan (MMC) is also part of the finance sector, but in the insurance industry. After a failed breakout at 21, the stock declined to around 18.5 by the end of May. MMC did manage to hold above its March low and rallied back to resistance by mid June. A consolidation formed over the last 2-3 weeks and a break above the consolidation highs would be bullish. Although it is only a few weeks, MMC has been showing relative strength with its advance in June.
*****************************************************************
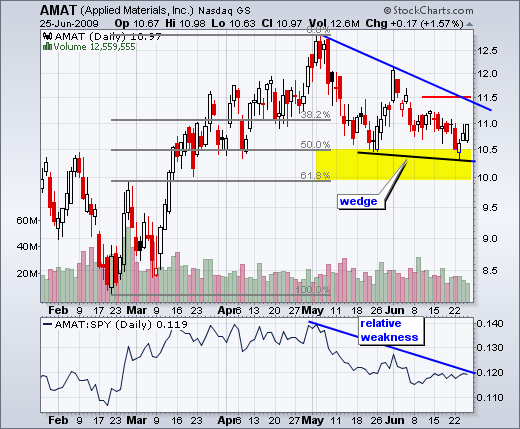
Applied Materials (AMAT), a leading semiconductor equipment company, sports an all too familiar setup (falling wedge, 50-62% retracement, small bounce). This is a good spot for a reversal, but the bounce over the last three days occurred on relatively weak volume. Follow through on bigger volume is needed before anticipating a breakout.
*****************************************************************
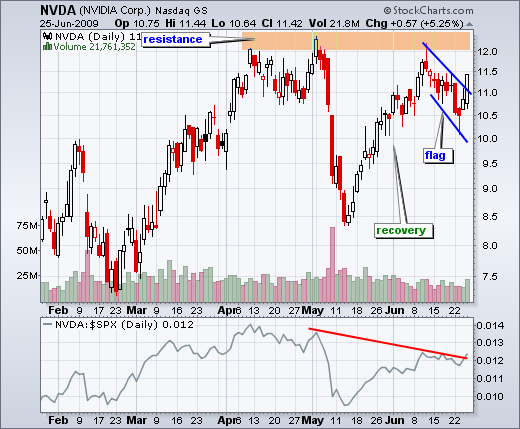
I featured Nvidia (NVDA) last Friday as it formed a shooting star at resistance. The stock continued its decline on Monday, but firmed on Tuesday with a hammer and surged over the last two days. NVDA is showing some serious resilience since the sharp decline in early May. A falling flag took shape in the last 2-3 weeks and the stock broke flag resistance on Thursday. As a graphics card manufacturer, NVDA could also benefit from a PC upgrade cycle as the release of Windows 7 draws near.
*****************************************************************
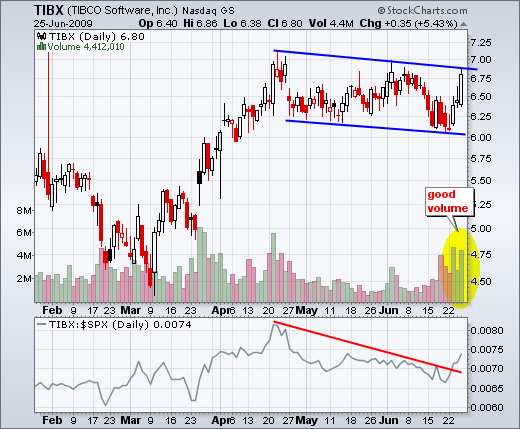
Tibco Softare (TIBX) came across the radar screen with a high volume surge over the last three days. After a sharp advance in March-April, the stock corrected with a falling channel in May-June. The surge over the last three days carried TIBX to channel resistance. Given the volume and the breakout in the price relative (TIBX:$SPX ratio), I would expect a channel breakout as well.
*****************************************************************

