 - Index ETF Charts: SPY, $RUT, $OEX, $NAHL
-Stock Charts: WHR, XHB, DHI, CAKE, KR, SLE, WMT, FLO, INTC, KLAC, INTC
- Today's video will be posted by 10:15 AM ET
- The next update will be Friday (June 26) by 9AM ET.
*****************************************************************
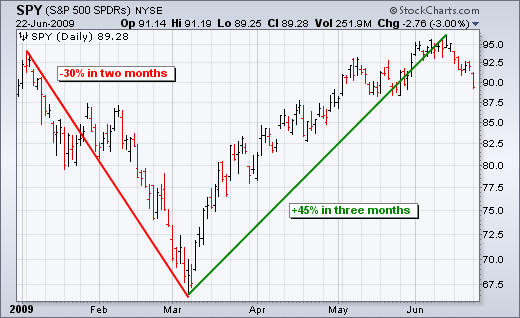
The major index ETFs broke down on Monday with sharp declines. With a number of bearish signals coming together, it looks like a medium-term downtrend is now underway. Will this be a correction within a bull market or another leg down in an ongoing bear market? Does it really matter? After all, the S&P 500 ETF (SPY) declined 30% to start the year and then surged over 40% in just three months. These are long-term moves (2-3 years) within medium-term time frames (2-3 months). Given the magnitude of these moves, another double-digit swing within a few months is certainly not out of the question. A 10% decline would reach 86.4, while a 20% decline would reach 77.
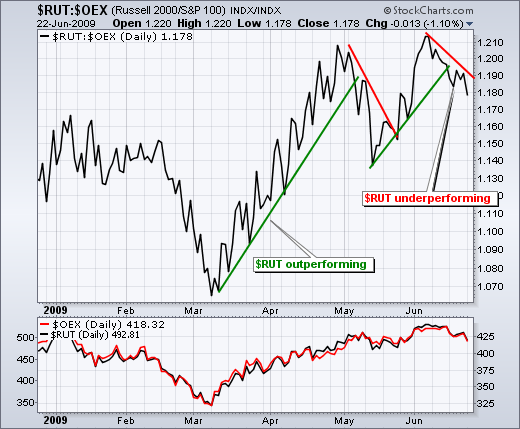
Let's review some of the medium-term bearish signals that came across the radar over the last few weeks. First, small-caps have been leading the way lower in June. The chart below shows the price relative ($RUT:$OEX ratio) peaking in early June and declining sharply over the last two weeks. Small-caps are like the canaries in the coal mine: they are the first to suffer should the economy sour.
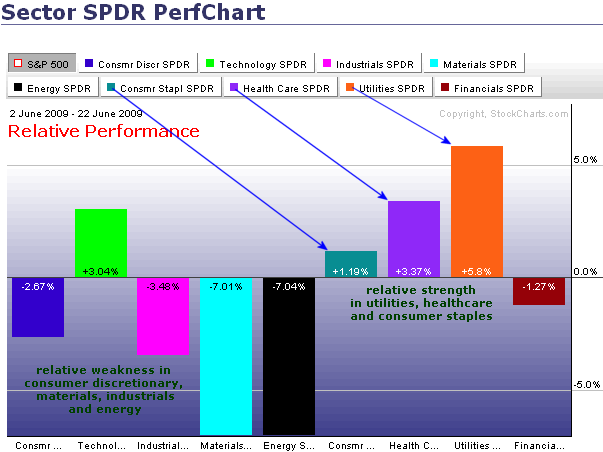
We are seeing relative weakness in the consumer discretionary sector in the month of June. This is the most economically sensitive sector and relative weakness is not a good sign of the overall market. This weakness can be attributed to homebuilders, retailers and transports. Also notice that the defensive sectors are showing relative strength as money rotates into utilities, healthcare and consumer staples.
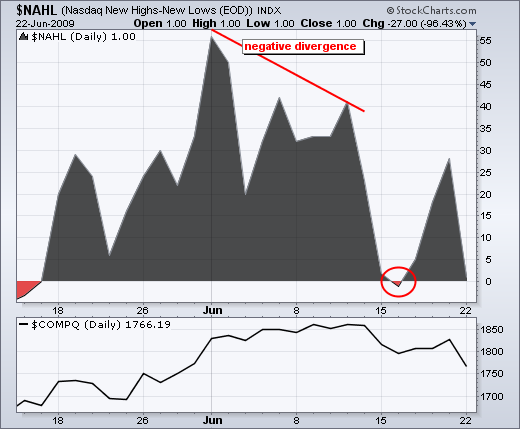
Breadth continues to deteriorate. In early June, John Murphy pointed out the negative divergence in the percentage of stocks above their 50-day moving averages - both Nasdaq and NYSE. With fewer stocks trading above their 50-day averages in June, there were fewer stocks partaking in the rally. There were also negative divergences in the NYSE AD Volume Line and New Highs for the Nasdaq. In fact, Net New Highs dipped into negative territory last week.
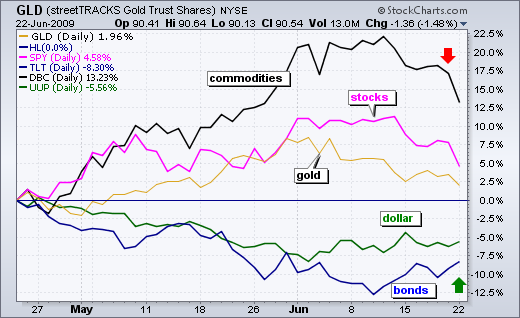
The flight-to-safety trade returned in June as money moved into the Dollar and bonds. Stocks, commodities and gold continued their advances in May to keep their positive correlations intact. At the same time, the Dollar and bonds extended their declines. This changed in June. Stocks, commodities and gold declined over the last few weeks, while the Dollar and bonds rebounded.
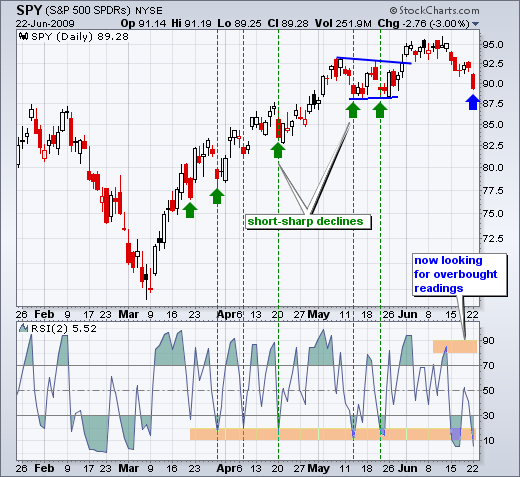
The decline over the last seven days was the deepest since late February-early March. As the green arrows show, prior declines lasted 1-3 days and SPY lost 2-5%. The declines were sharp, but short. The current decline is now six days old and SPY is down around 6%. This decline is clearly not like the other pullbacks. SPY is already short-term oversold as it nears its May lows. The bottom indicator window shows 2-period RSI, which is used to identify short-term overbought and oversold conditions. During the uptrend, a move below 20 indicated a short-term oversold condition that provided a good entry point. Should a medium-term downtrend start, we can use the opposite by looking for short-term overbought situations with a move above 80.
*****************************************************************
Whirlpool (WHR) remains on my watch-list with a bearish flag forming over the last 6 weeks. The stock never recovered after the sharp decline in early May. Even though it did firm with the flag consolidation, it remains well below its May high and shows relative weakness. There is a ton of resistance around 42.5-45 and a break above this zone would be bullish. Barring a break, I view this flag as potentially bearish. Momentum is starting to slip as RSI broke below 50 for the first since March.
*****************************************************************
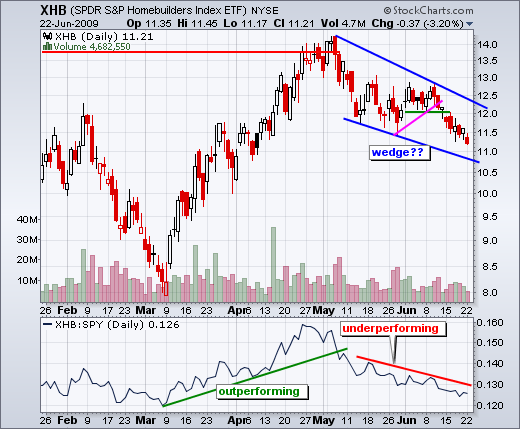
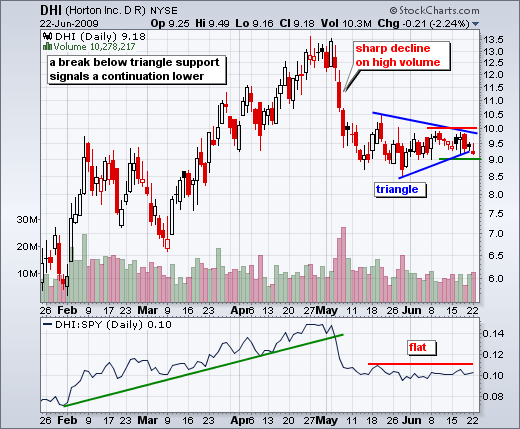
Homebuilders will be in the spotlight today as the National Association of Realtors releases the May report for existing home sales. As the price relative shows, the Homebuilders SPDR (XHB) has been underperforming since early May. It is possible that a bullish wedge is taking shape, but this wedge is still falling and the trend is currently down. No sign of a breakout here. Within the group, DR Horton (DHI) remains within a triangle consolidation with support at 9 and resistance at 10. The noose is tightening as the range narrows. On the potentially bullish side, DHI is holding its own by trading flat the last three weeks. However, we have yet to see a triangle breakout on the price chart or a price relative breakout to show relative strength.
*****************************************************************
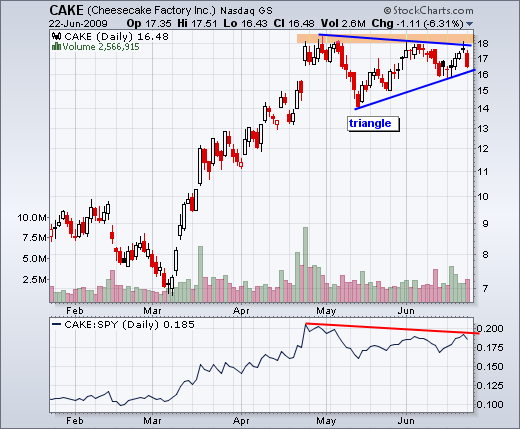
Cheesecake Factory (CAKE) reverses at resistance. CAKE met resistance around 18 in late April, early May, early June and mid June. The stock has attempted to breakout this level at least four times in the last three months. There was a nice surge to resistance last week, but CAKE turned indecisive on Friday and declined sharply on Monday. This makes for another failure at resistance. After a massive advance from 7 to 18, a 38-62% retracement would be perfectly normal.
*****************************************************************
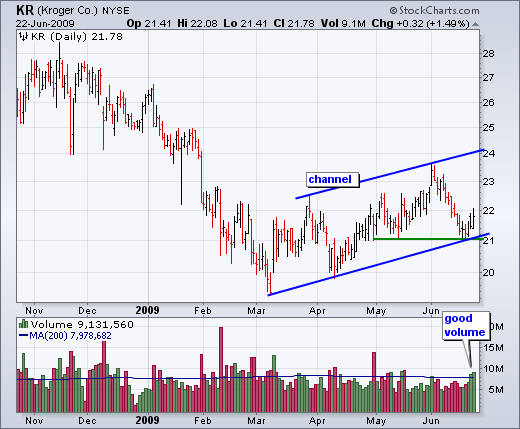
With the consumer staples sector showing some relative strength on Monday, a few of these defensive stocks came across my radar. Kroger (KR) got hit hard the first half of June, but found support near 21 over the last five days. Support in this area stems from the rising price channel and the May lows. Perhaps more importantly, the stock bounced off support with good volume over the last two days.
Sara Lee (SLE) is still holding support around 8.75. The stock broke resistance with good volume in early May and broken resistance turned into support. A high volume bullish engulfing formed last week and the stock stalled over the last three days. Look for follow through above 9.25 to confirm the bullish engulfing. This would also break wedge resistance.
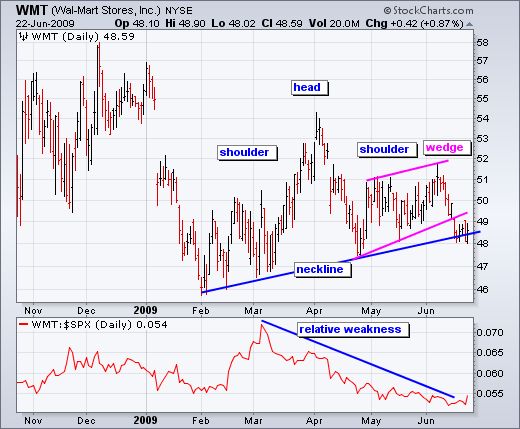
Despite a broad market decline on Monday, Wal-Mart (WMT) managed a modest gain to show relative strength for a day. I pointed out the head-and-shoulders pattern before and the stock is testing neckline support with a consolidation over the last five days. WMT already broke wedge support with a sharp decline below 49. Despite this break, there is a lot of support around 47.5-49 from the April-June lows. A strong move back above 49 would argue for a reassessment of this bearish setup.
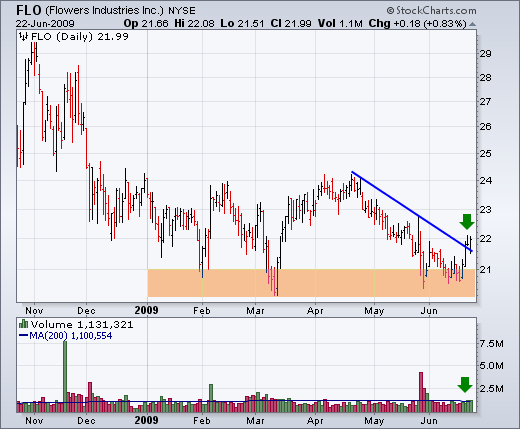
Flowers Industries (FLO) is showing signs of life with a high-volume surge off support. The stock established support around 21 with four bounces this year. After a high-volume decline in late May, the stock bounced off support and held on the subsequent test in mid June. The surge over the last four days looks impressive because it occurred in the face of market weakness. FLO broke trendline resistance and volume was pretty good the last two days.
*****************************************************************
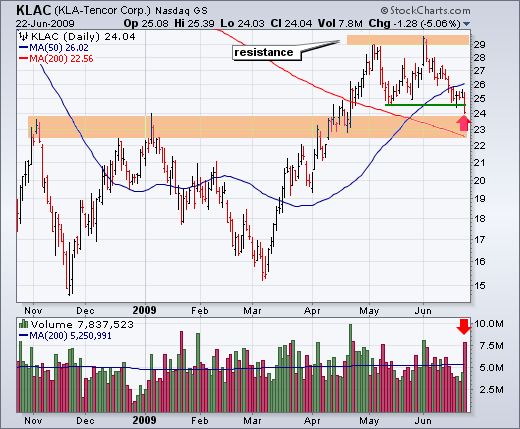
The technology sector took a hard hit on Monday with semis showing particular weakness. KLA-Tencor (KLAC) broke support from its May low with high volume. This break is short-term bearish, but there may be support soon. The falling 200-day moving average (red line) marks potential support around 22.5-23. There is also a chance that broken resistance around 23 turns into support.
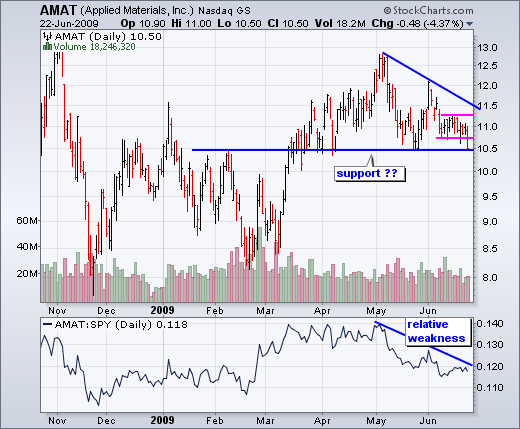
Applied Materials (AMAT) broke consolidation support with a sharp decline on Monday. With the price relative peaking in early May and moving lower the last seven weeks, the stock has been showing relative weakness for some time now. There is potential support around 10.5 from broken support and the April-May lows, but yesterday's consolidation break is bearish until proven otherwise.
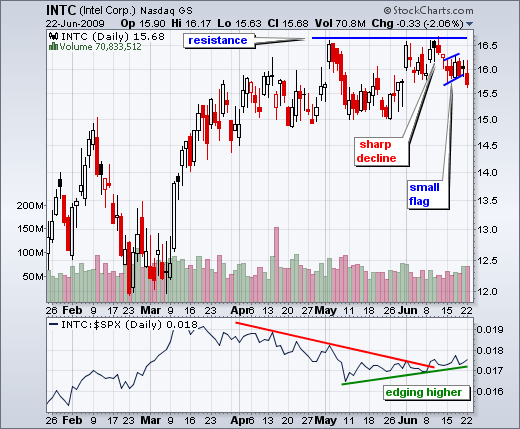
I featured Intel (INTC) on Friday morning with a small wedge. After further review, I am calling this a small rising flag. The name does not really matter. What matters is that it is a rising consolidation, which is bearish. The stock broke consolidation support with a sharp decline on pretty good volume yesterday.
*****************************************************************

