Today's Charts Include: AMZN, ANF, ARO, CEPH, CHRW, COV, CPRT, FDX, GILD, INTC, IYT, JBHT, JWN, RL, UPS, XRT.
The next update will be Tuesday (May 19th) around 9AM ET.
*****************************************************************
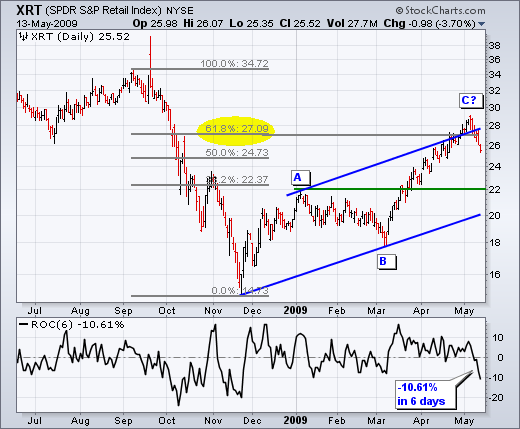
The consumer discretionary sector and the retail group were hit hard over the last three days. Actually, the Retail SPDR (XRT) was hit hard (-10.61%) over the last six days. Is this just a short pullback or is this the start of a bigger decline? Compared to the prior decline, the November-May advance still falls short. XRT did exceed the 62% retracement mark and the upper trendline of the rising price channel, but overshoots are part of the game. The November decline was probably an overshoot as well. With a 10% decline over the last six days, I think the May high will hold for a few weeks and we are entering a corrective phase. Broken resistance around 22 turns into support and this is the first are to watch on a pullback. After a 10% decline, XRT is already getting short-term oversold and we could see a oversold bounce in the coming days.

*****************************************************************
The next charts come from the retail group. The first four show stocks with sharp declines over the last few days. In the indicator window, 5-period RSI moved below 30 to become oversold. I do not consider this a bullish signal, but it does reflect a short-term oversold condition that could give way to a bounce in the coming days. I consider overbought and oversold readings as yellow flags (caution). A bearish bounce would feature low volume and retrace around 50% of the decline. This means a reaction high would form below the prior high (a lower high). Except for Amazon, the decline over the last few days featured high downside volume, which is not normally associated with a mere pullback. Such an increase in selling pressure suggests that a bigger correction will unfold over the next few weeks.


Abercrombie & Fitch (ANF) actually held up pretty well over the last two weeks. However, the stock is trading near resistance from the April highs and MACD formed a negative divergence. MACD also moved below its signal line over the last few days. The pink like shows the Accumulation Distribution Line moving sharply lower in May. This reflects an increase in selling pressure that could weigh on the stock in the coming days or weeks. A break above 27.5 would call for a reassessment.

*****************************************************************
Transport stocks also took a beating over the last few days. After a high volume reversal day last Thursday, the Transport iShares (IYT) broke below channel support with a sharp decline. The price relative also broke below its March trendline. Transports were showing upside leadership from early March until early May. Not any more. It makes sense that transports would follow retail lower. After all, transport companies are in charge of moving the goods.

The next four charts feature key stocks from the transportation group. The depth of the decline over the last five days stands out. Fedex (FDX) is down over 14%, JB Hunt (JBHT) is down 12%, CH Robinson (CHRW) is down over 8% and UPS is down over 6%. UPS is the least volatile of the group so this partially explains the relatively small decline. Even though these declines did not occur on high volume, they are sharp enough to signal the start of a longer correction. Many are already short-term oversold, which could give way to an oversold bounce in the coming days.


*****************************************************************
Intel (INTC) shows relative weakness with a failed surge. The Semis and Intel were looking pretty good with surges and breakouts in early May. However, Intel failed to hold its gap-surge and declined back to support over the last seven days. Further weakness below the mid April lows would trigger a bearish support break. In the bottom indicator window, the price relative peaked in mid March and declined over the last two months. Intel actually shows relative weakness and this strengthens the bearish case.

*****************************************************************
Copart (CPRT) declines on high volume. Copart led the market higher in February and March, but hit resistance at the end of March and stalled the last few weeks. With the market moving higher in April, Copart showed relative weakness by trading flat. Resistance around 32 is well established and a break above this level would be bullish. However, it looks like Copart has failed after a high volume decline on Wednesday. Copart provides online marketing and sales services to auto-related companies.

*****************************************************************
Gilead Sciences (GILD) tests support with a small pennant. GILD has been battling support since early March with numerous bounces over the last two months. The stock surged above 48 twice, but came back to support soon thereafter. Most recently, a small pennant consolidation formed just above support. Watch these pennant boundaries for the next signal. Gilead is a biopharmaceutical company.

*****************************************************************
Covidien (COV) continues to show relative strength with a high volume breakout. After a surge in March, the stock formed an ascending triangle from early April to early May. These are bullish continuation patterns and the breakout signals a continuation higher. Volume was above average four times over the last three weeks. In particular, volume was above average on yesterday's breakout. Moreover, the breakout occurred on a day when the market was weak. Covidien manufactures and sells medical instruments, devices and equipment.

*****************************************************************
Despite market weakness over the last three days, Cephalon (CEPH) surged to flag resistance. The stock plunged in February with a decline from 80 to the low 60s in a few weeks. That's what biopharmaceutical stocks do sometimes. After a rebound in March, the stock corrected with a falling flag in April. CEPH found support around 64 in late April and early May. A break above 68 would break the flag and call for a continuation higher. I am, however, concerned that upside volume has not been that strong.

***************************************
