Charts Worth Watching: ANF, BIIB, CHH, CL, FLML, GLD, IBB, ITB, LEN, MDC, NIKE, QQQQ, SEPR, SPY, SVU, VRTX, WMT, XLP, XLY.
Scheduling Note: The next posting will be on Tuesday, May 12 around 9AM ET.
*****************************************************************
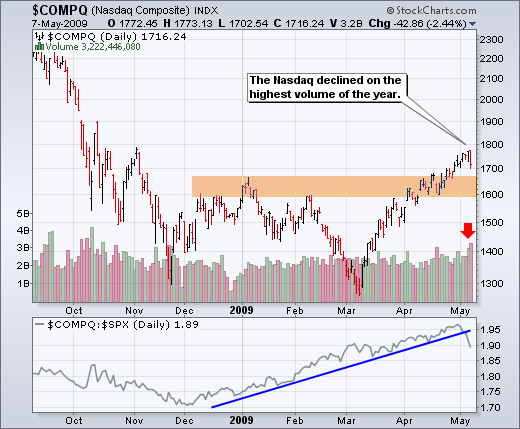
The Nasdaq declined with the highest volume of the year on Thursday. While a sharp decline on surging volume is negative, don't forget that the index also fell on the (then) highest volume of the year in the second half of April. So far, the decline is just one day and we have yet to see follow through. Prior declines were limited to 1-2 days. The first 3-day decline could suggest that a more lasting change is afoot. The bottom indicator shows the price relative breaking below the rising blue trendline with a sharp decline in May. As noted in Thursday's market message, the Nasdaq is showing relative weakness in May and this is negative for the market overall.
*****************************************************************
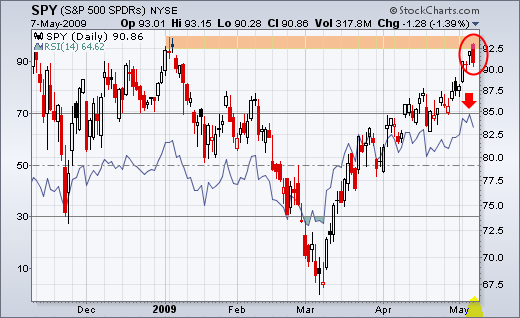
The S&P 500 ETF (SPY) formed a bearish engulfing at resistance on Thursday. These candlestick patterns form with a strong open and weak close that fully engulfs the prior candlestick's body (open-close range). Also notice that this candlestick pattern occurred near the January high. Furthermore, 14-day RSI reached 69.56 on Wednesday, which is close to overbought levels (70). Even thought the medium-term trend is still up, the advance is running into some serious obstacles.
*****************************************************************
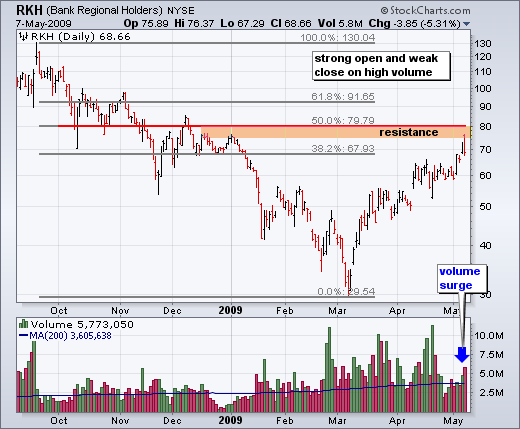
The Regional Bank HOLDRS (RKH) also opened strong and closed weak on Thursday. In addition, the ETF is trading near resistance. A bearish engulfing did not form because RKH closed just above the prior day's open. However, a bearish dark cloud pattern did form. These form when the open is above the prior day's high and the close is below the mid point of the prior candlesticks' body. Also notice that volume during this week's surge was relatively light and volume surged with yesterday's decline. Selling pressure is intensifying at resistance.
*****************************************************************
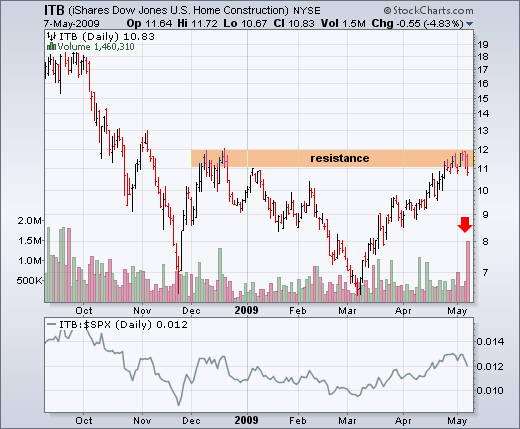
Speaking of resistance, the Home Construction iShares (ITB) hit a resistance zone in late April and declined on big volume Thursday. In fact, volume was the heaviest since September. The combination of resistance and a high volume decline increase the chances of a correction.
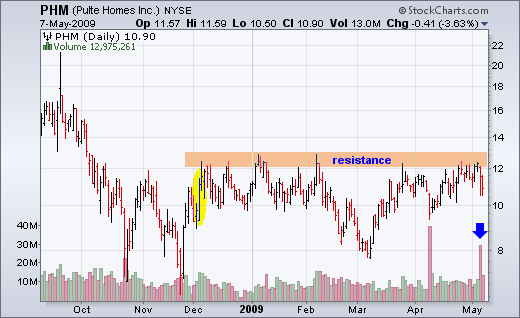
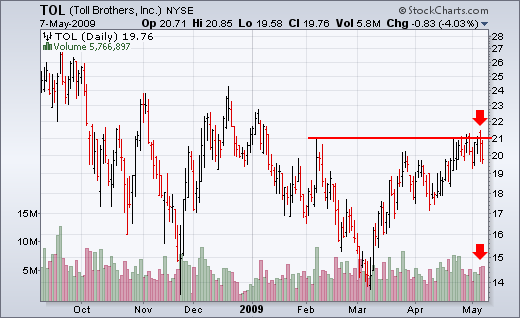
Within the group, Pulte Homes (PHM) declined sharply after hitting a resistance zone around 12. Toll Bothers (TOL) hit resistance around 12 on April 22nd and stalled for two weeks. The stock declined sharply with high volume the last two days.
*****************************************************************
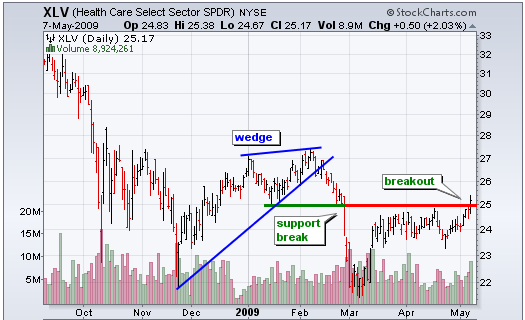
Money rotated from the technology sector to the healthcare sector on Thursday. As noted in the Market Message, the Healthcare SPDR (XLV) broke above resistance at 25 with good volume on Thursday.
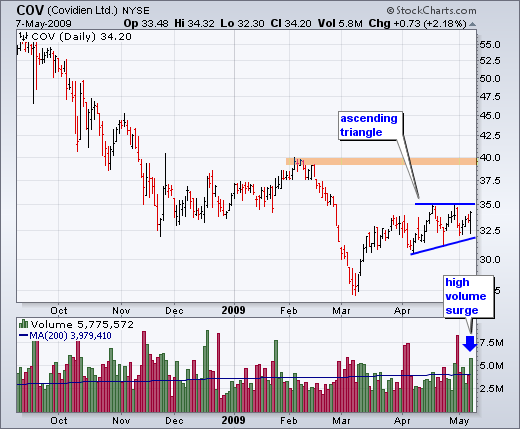
Within the sector, Covidien (COV) is forming a potentially bullish ascending triangle. After surging with the market in March, the stock consolidated for the last five weeks. Notice that COV hit resistance at 35 twice and formed higher lows during the consolidation process. A break above 35 would confirm the pattern and target further strength towards the next resistance around 40. Covidien produces medical devises, instruments and supplies.
*****************************************************************
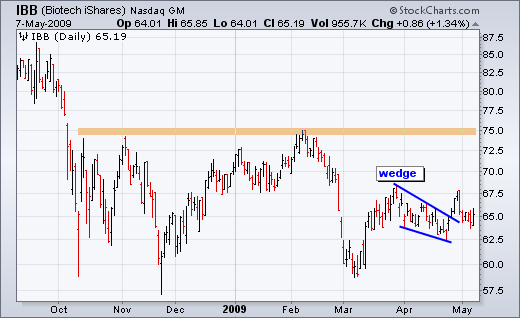
The Biotech iShares (IBB) showed a day of relative strength as it advanced in the face of market weakness yesterday. IBB broke wedge resistance with a surge in late April, but declined back to the breakout with a rather sharp decline. Thursday's bounce reinforces support to keep this wedge breakout alive.
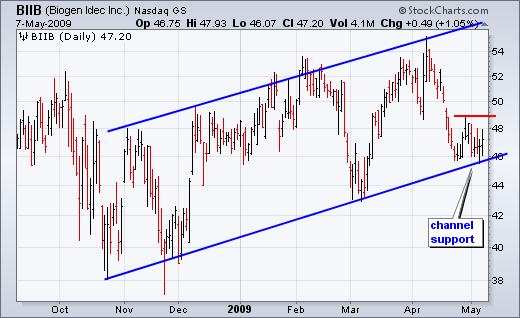
Within the group, Biogen Idec (BIIB) is currently moving higher within a rising price channel. Even though the trendlines do not touch the exact lows, they capture the general picture of higher highs and higher lows. Biogen is consolidating at channel support. A break above the consolidation highs would argue for a continuation of this rising channel. Trading note: Biotech stocks carry above average risk.
*****************************************************************
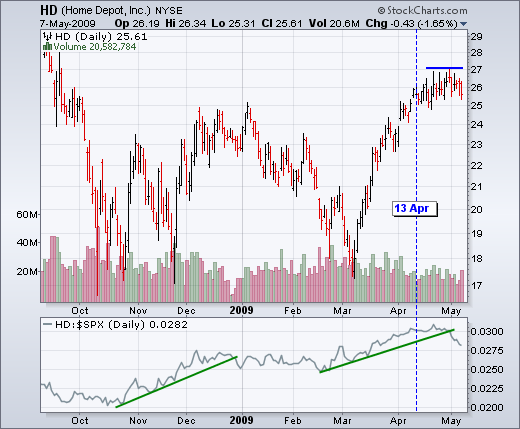
The next four stocks come from the consumer discretionary sector, which has been red hot since early March. Home Depot (HD) surged from 17.5 to 27 (+50%) in less than two months. The stock actually started stalling after it first moved above 26 on April 13th (blue dotted line). HD has gone nowhere the last four weeks and lost some of its luster. While I would not expect a test of the March lows, the stock looks vulnerable to a pullback or correction.
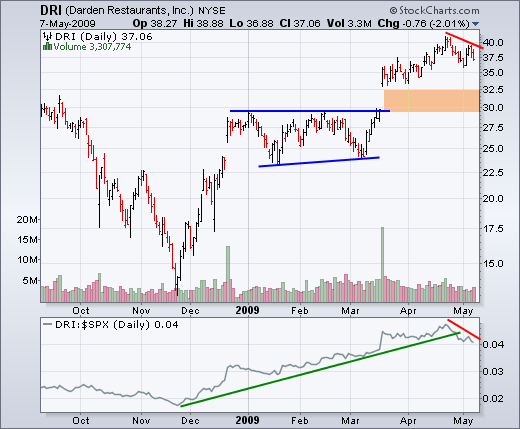
Darden Restaurants (DRI) is getting some vertigo has it trades almost 200% above its November lows. DRI surged above consolidation resistance with a gap in mid March. While the S&P 500 moved to new highs in May, DRI formed a lower high in early May. In addition, the price relative broke its up trendline and also formed a lower high. The stock looks vulnerable to a pullback that could carry it back to broken resistance (~30).
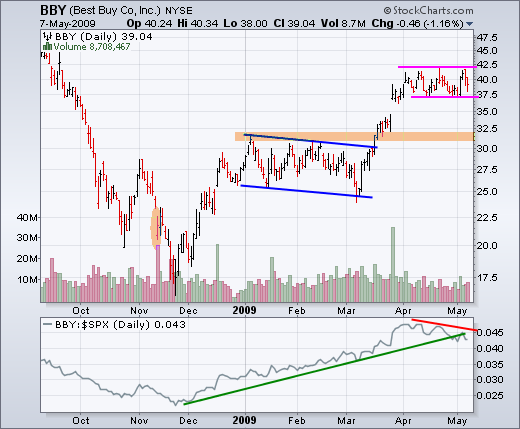
Best Buy (BBY) sports chart characteristics similar to Darden. BBY also broke consolidation resistance with a big move in mid March. While the S&P 500 moved higher throughout April, Best Buy traded flat with a consolidation. This amounts to relative weakness as the price relative edged lower. BBY looks vulnerable to a correction from current levels and this could carry it back to the resistance breakout (~31).
Nike (NKE) continues to meet resistance as it consolidates near its 62% retracement mark. Looking at the volume bars, the highest volume has been to the downside since late April (red bars). In addition, the price relative broke the February trendline and NKE is starting to show relative weakness. As with the other three, NKE looks vulnerable to a pullback from its lofty perch.
*****************************************************************
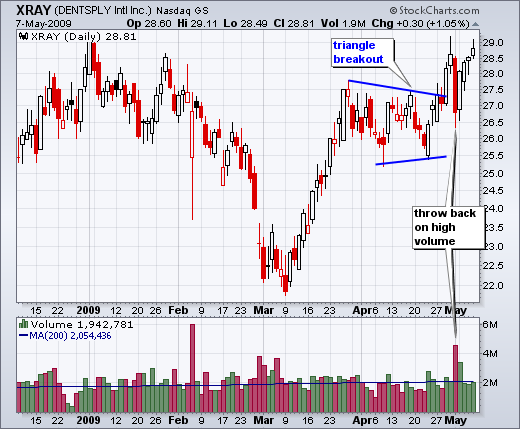
The next two charts feature a breakout that came under pressure and a breakout that is currently under pressure. Breakouts are supposed to signal the start of significant move. However, there are often throwbacks that challenge the breakout – and our stomachs. I featured Denstply (XRAY) just after it broke triangle resistance. Two days after the breakout, the stock declined sharply with big volume. This was a negative development, but XRAY recovered the very next day. Broken resistance levels turn into support that should hold. While a move below broken resistance on high volume is negative, market emotions can sometimes produce overshoots. This appears to be the case with XRAY as the stock immediately rebounded and moved back above 28.5.
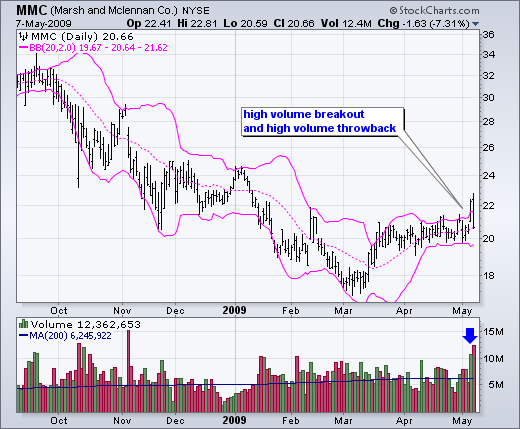
I featured Marsh & McLennan (MMC) on Tuesday as the Bollinger Bands narrowed with a volatility contraction. The stock broke resistance with a big surge on Wednesday, but gave it all back with a high volume decline on Thursday. Even though the breakout did not hold, we could be looking at an overshoot with Thursday's decline. If it is an overshoot, then MMC should recovery quickly and move higher. Failure to recovery and further weakness below 20 would suggest otherwise.
