- Sector ETF Leaders and Laggards (XLY, XLB, XLK, XLP, XLV, XLE)
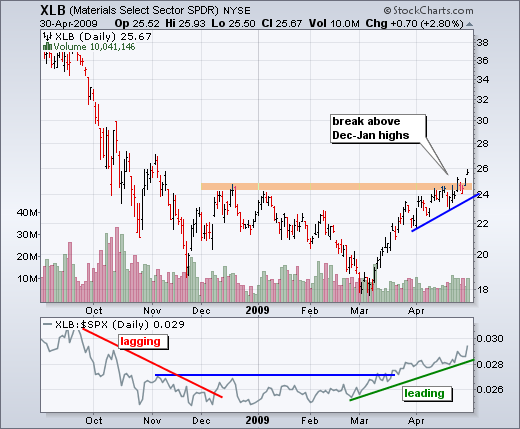
The Materials SPDR (XLB) was the latest to join the sector breakout club. With a surge from 18 to 26 (~30%), the ETF broke above its Dec-Jan highs over the past five days. The bottom indicator shows the price relative in a clear uptrend as XLB outperforms the S&P 500. Even though XLB is overbought, there are no signs of weakness yet and the uptrend remains in place.
*********************************************************
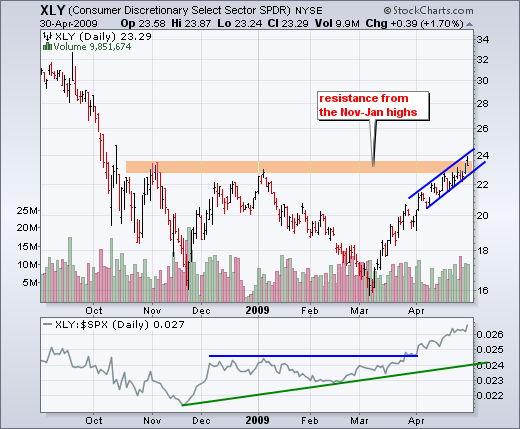
The Consumer Discretionary SPDR (XLY) is also showing relative strength by moving above its January high this week. In the indicator window, the price relative broke out at the end of March and also remains in a clear uptrend. Relative strength in the most economically sensitive sector is bullish for the market overall.
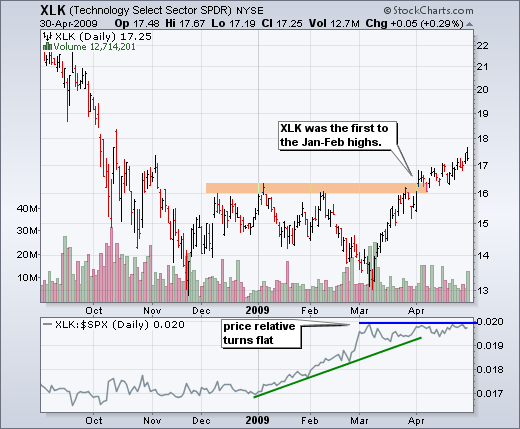
The Technology SPDR (XLK) is the third sector showing upside leadership. XLK was the first sector to break above resistance. The price relative flattened since early March as the S&P 500 took off as well. However, a flat price relative simply means that XLK is trading in line with the S&P 500. I would not become concerned with relative performance unless the price relative breaks its March lows.
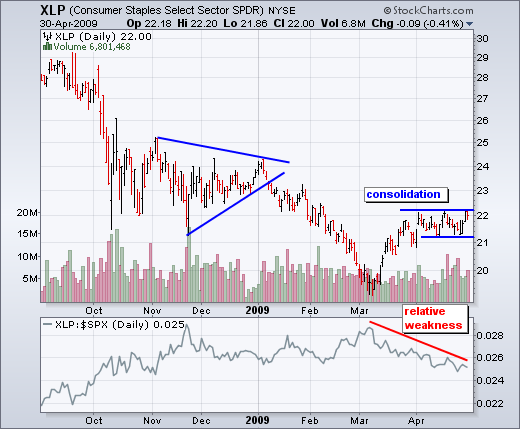
The Consumer Staples SPDR (XLP) has not kept pace with the S&P 500 over the last two months. XLP surged with the market in March, but then traded flat in April. With the S&P 500 moving higher in April, the price relative moved sharply lower. On the price chart, a consolidation formed and I am watching the boundaries for a break.
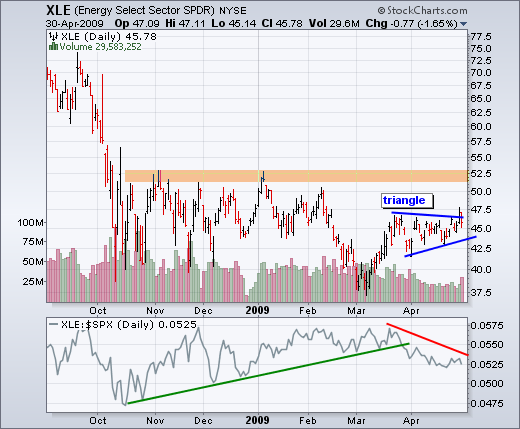
The Energy SPDR (XLE) shows relative weakness as its price relative moved lower over the last six weeks. The ETF surged in early March, but trading turned flat with a triangle consolidation taking shape. Even though relative weakness is a concern, I am watching the triangle boundaries for a signal/break. Wednesday's breakout attempt failed after Thursday's sharp decline. Further weakness below the late April low would be bearish.
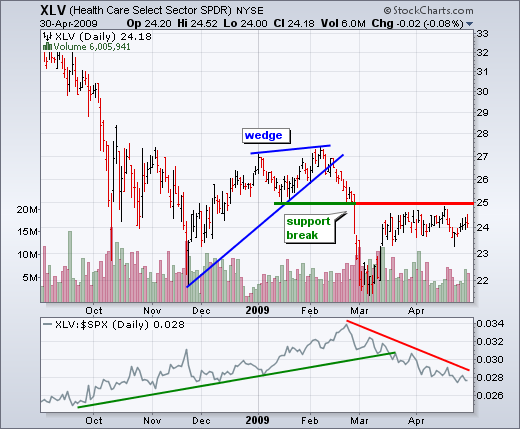
The Healthcare SPDR (XLV) had the shortest March rally. While the S&P 500 surged from 10-March until the end of the month (~3 weeks), the XLV surge lasted a week as trading turned flat in mid March. Notice that broken support turned into resistance around 25. Also notice how the price relative peaked in late February and moved straight down the last two months. The price relative needs to break the red trendline and XLV needs to break resistance at 25 to reverse course. Also of note, XLU has chart characteristics similar to XLV.

