Charts Worth Watching: BTU, CVX, ELON, EWW, KOL, LUB, MMC, RF and SLV.
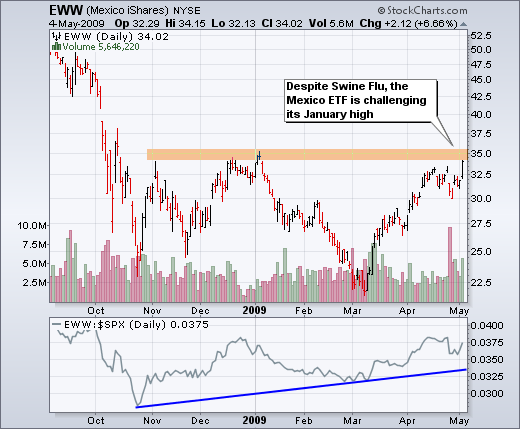
Even though Mexico is ground-zero for swine flu, the Mexico ETF (EWW) shows no signs of the bug as it challenges resistance from the January high. There was a gap down last week, but the ETF recovered its losses and closed above its April high. Looks like the market is watching the chart more than CNN.
*****************************************************************
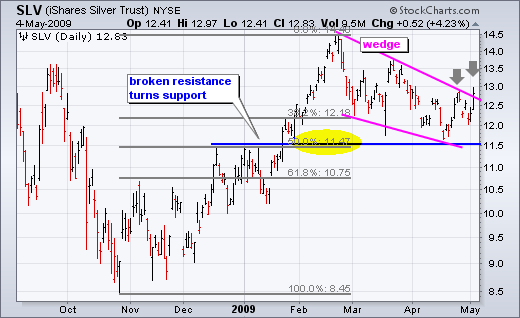
The Silver ETF (SLV) sports a chart pattern similar to the Gold SPDR (GLD). SLV surged from late October until late February and then corrected with a falling wedge. Notice that the wedge retraced 50% of the prior advance and found support near broken resistance (~11.5). The first trendline break failed, but SLV broke trendline resistance with its second attempt yesterday.
*****************************************************************
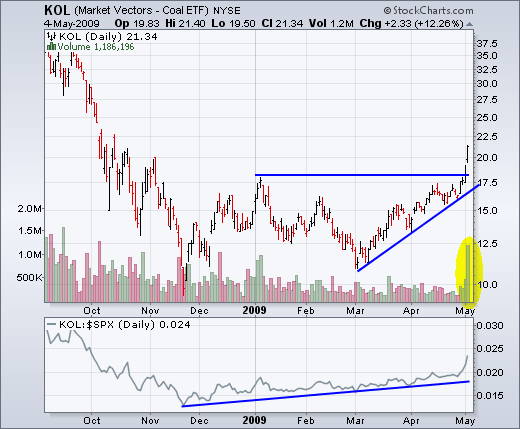
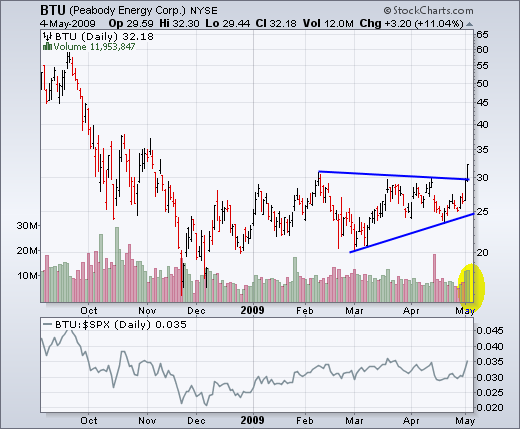
Coal stocks were on fire Monday as the Coal ETF (KOL) broke above its January high with big volume on Monday. Peabody Energy (PBE) followed suit with a triangle breakout on above average volume. While these breakouts are bullish from a technical standpoint, these stocks are already getting frothy after big advances. BTU is up some 28% in four days, while KOL is up over 30% in four days. Broken resistance levels turn into the first support levels to watch on any pullback
****************************************************************
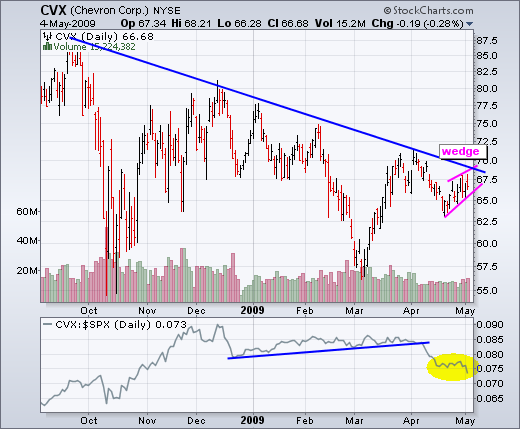
Even though the Energy SPDR (XLE) broke resistance over the last two days, ChevronTexaco (CVX) continues to show relative weakness. In the indicator window, the price relative turned down over the last few days and recorded a new low for the year yesterday. On the price chart, CVX formed a rising wedge with support at 65. A break below wedge support would signal a continuation lower. Also notice that the big trend is down with trendline resistance in the upper 60s.
*****************************************************************
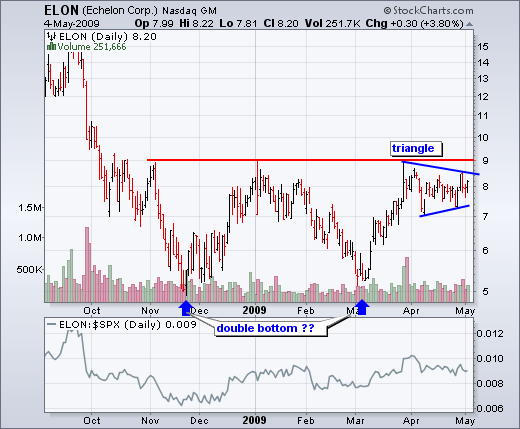
Echelon (ELON) consolidates below resistance. ELON has a large double bottom working with resistance around 9. After a surge to resistance in March, the stock consolidated in April by forming a triangle. A triangle breakout would signal a continuation of the March advance and project a break above double bottom resistance. Based on traditional technical analysis, a double bottom breakout would target a move to around 13. The height of the pattern is added to the breakout for a target. Watch for an increase in volume to validate any breakout. Echelon produces hardware and software systems to manage energy networks.
*****************************************************************
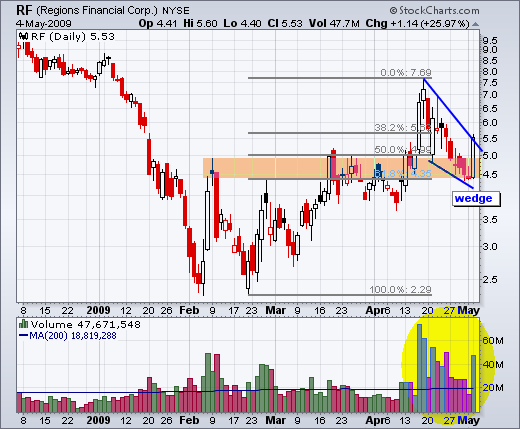
With stress test results looming for many banks, volatility and risks could be high in the financial sector this week. Regions Financial (RF) started the week with a surge on big volume. Overall, the stock formed a falling wedge that retraced 62% of the prior advance. In addition, RF found support near broken resistance from the February highs. Support has been affirmed with Monday's big surge on high volume. In addition, notice that volume was strong during the April surge. Strong upside volume bodes well for a continuation of Monday's surge.
*****************************************************************
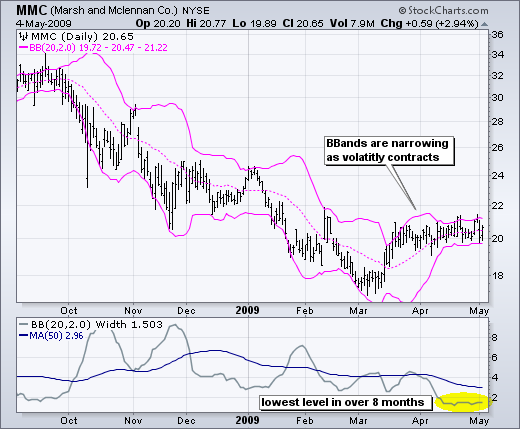
Marsh & McLennan (MMC) consolidates as the Bollinger Bands narrow. One theory behind Bollinger Bands is that volatility contractions are followed by volatility expansions. Bollinger Bands do not, however, provide clues on the direction of the next move. On the price chart, MMC surged above the upper Bollinger Band in mid March and then consolidated for six weeks. Notice how the bands narrowed as the range tightened. The bottom indicator shows Bollinger Band width at its lowest level in over 8 months. A move above the April highs would break consolidation resistance and argue for further strength into the mid 20s. A break below the lower Bollinger Band would be negative and argue for a test of the March low. Marsh & McLennan is an insurance broker that is part of the financial sector.
*****************************************************************
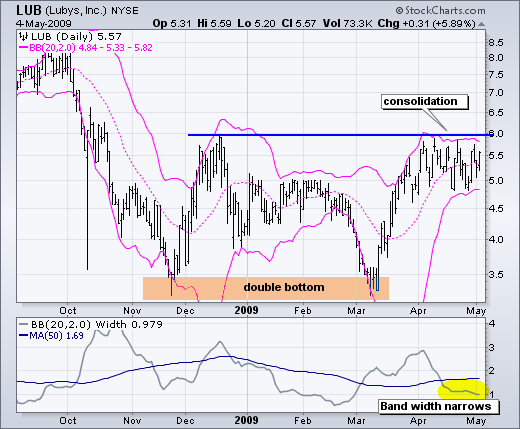
Luby's (LUB) consolidates below double bottom resistance. The big pattern at work is a double bottom with support around 3.3 and resistance around 6. A break above resistance would confirm the pattern and target further strength towards 8.5. After surging to resistance in early April, the stock consolidated the last few weeks with a flat trading range. This consolidation looks like a flat flag. Also notice that Bollinger Band width narrowed as volatility contracted over the last few weeks. Flag resistance is also at 6.
*****************************************************************

