While current technical conditions are "iffy" at best, I want to point out that we have just entered THE most bullish historical period of the year. The S&P 500 and NASDAQ can be broken down into 3 lengthy historical periods, in my view - the good, the not-so-bad, and the UGLY. Here is a breakdown on historical performance on the S&P 500 since 1950 (annualized returns shown):
- The Good (October 27th close through January 18th close): +21.22%
- The Not-So-Bad (January 18th close through July 17th close): +8.99%
- The UGLY (July 17th close through October 27th close): -1.29%
That "Good" period has also ended higher than it began in 62 of the 71 years since 1950. Has it gone up every year? Ummm, no. 9 years since 1950, it's moved lower. But clearly the odds favor the bulls. For those in the "secular" bear market camp that believe prices are going to continue to spiral lower, you'll be happy to hear that the cyclical bear market of 2018 AND the financial-crisis-related secular bear market of 2008 were both years that did not follow the bullish historical pattern. So, by no means is this a slam dunk. I'm simply pointing out historical fact and bullish odds.
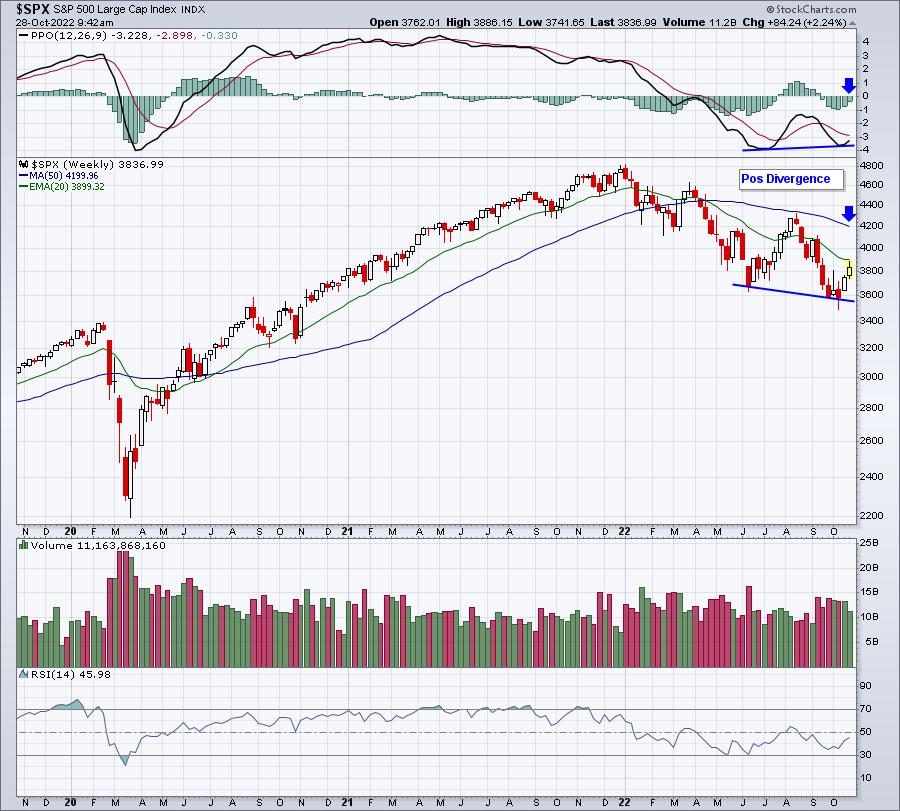
Technically, we do have a positive divergence on the weekly S&P 500 chart, so that would be one technical argument for higher prices a head on the S&P 500. Here's that weekly chart:

When I see positive divergences form, I immediately consider the higher probability of a 50-period SMA test and/or a PPO centerline test (blue arrows). That's worth watching throughout Q4.
Now onto the NASDAQ.
Again, let's break down those 3 historical periods, but this time since 1971:
- The Good (October 27th close through January 18th close): +23.53%
- The Not-So-Bad (January 18th close through July 17th close): +12.25%
- The UGLY (July 17th close through October 27th close): -5.58%
That's a HUGE disparity in performance and this is a trend that spans more than 50 years! (More than 70 years on the S&P 500) We need to understand that all days are NOT created equal in the stock market.
This is just one of MANY historical tendencies that you need to be aware of. Throw in the daily manipulation in the stock market throughout 2022 to favor those big Wall Street firms and it's a jungle for us retail traders. And no one cares about your money like you do. You MUST think objectively when making decisions about your trades and investments.
That's the reason we're having a SPECIAL virtual event next Saturday, November 5th on Market Manipulation. It is totally FREE (no credit card required), but you do need to register. Space is limited so SIGN UP NOW! For more information and to register, CLICK HERE.
Happy trading!
Tom
