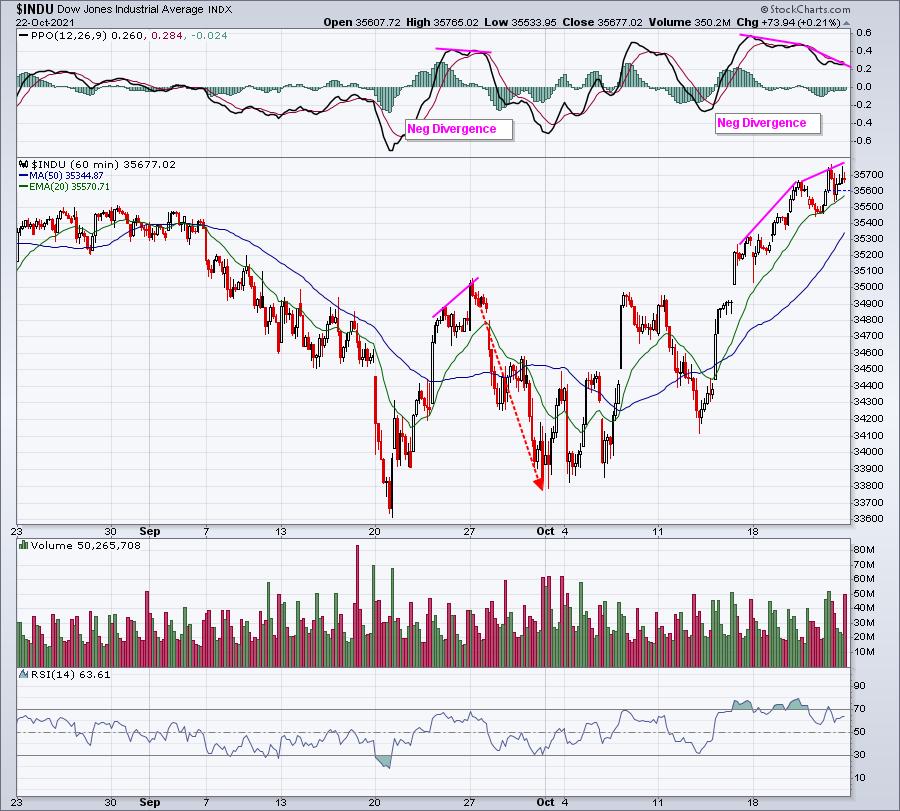
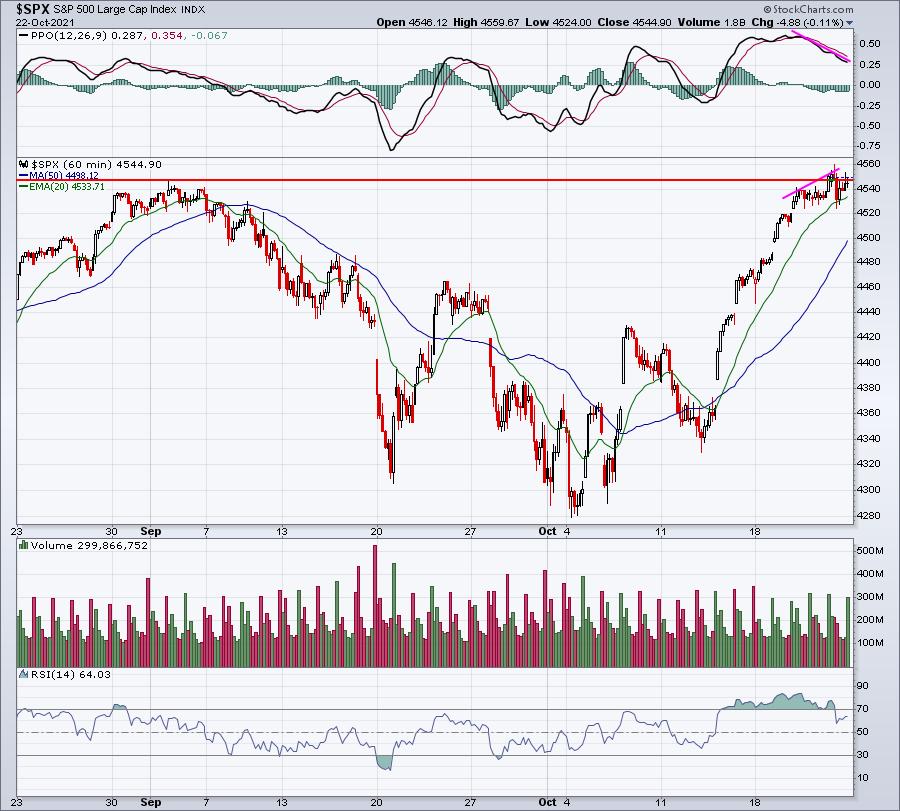
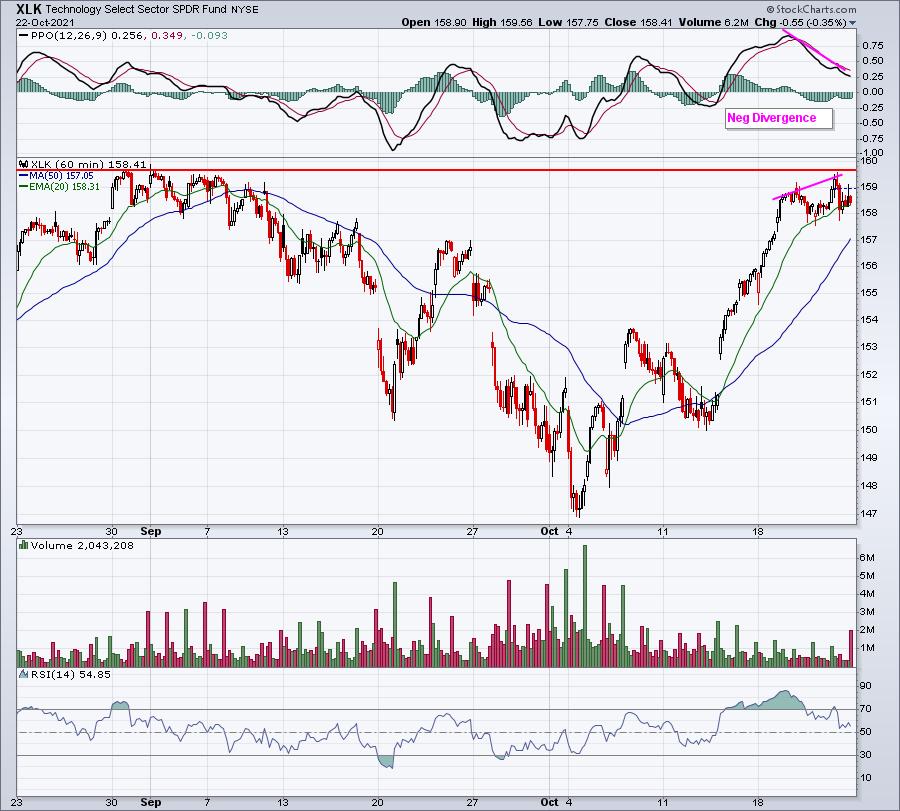
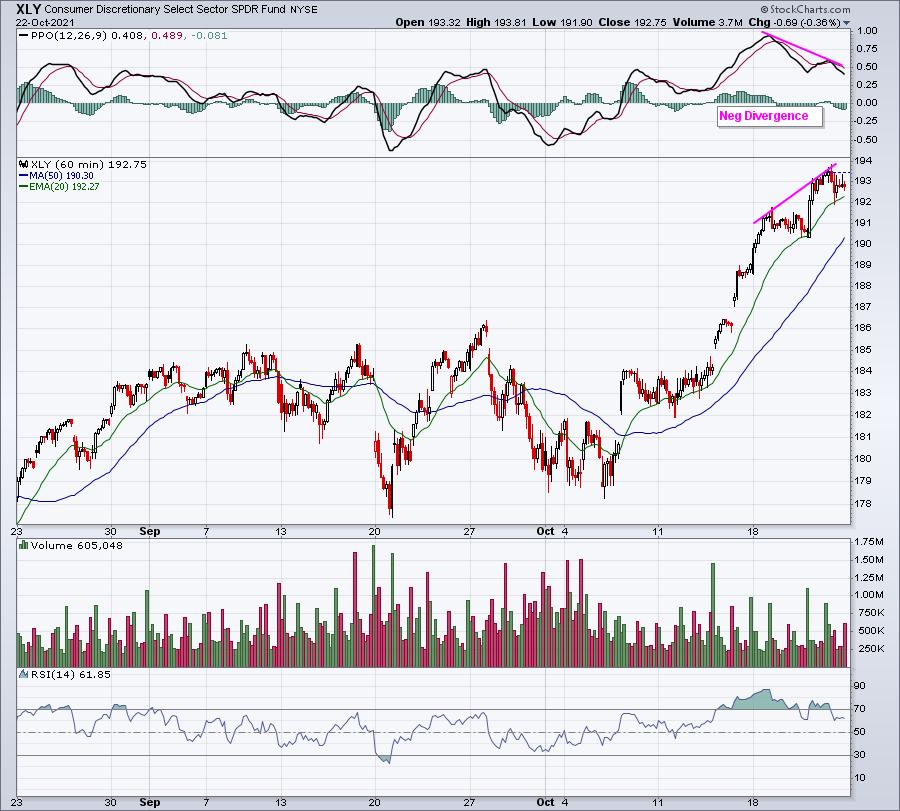
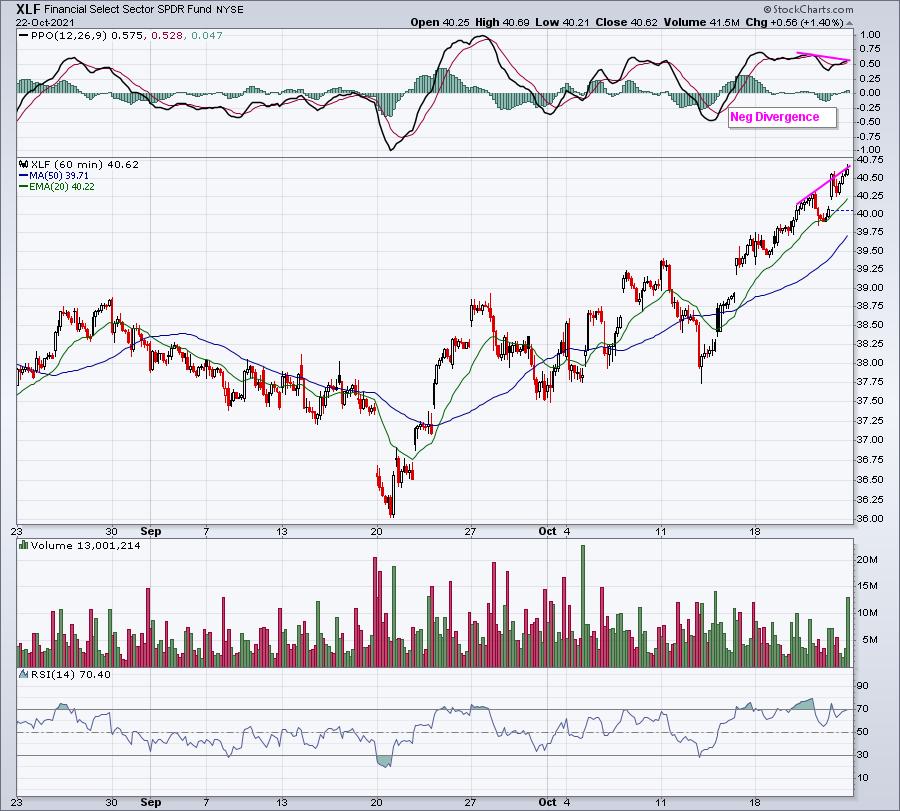
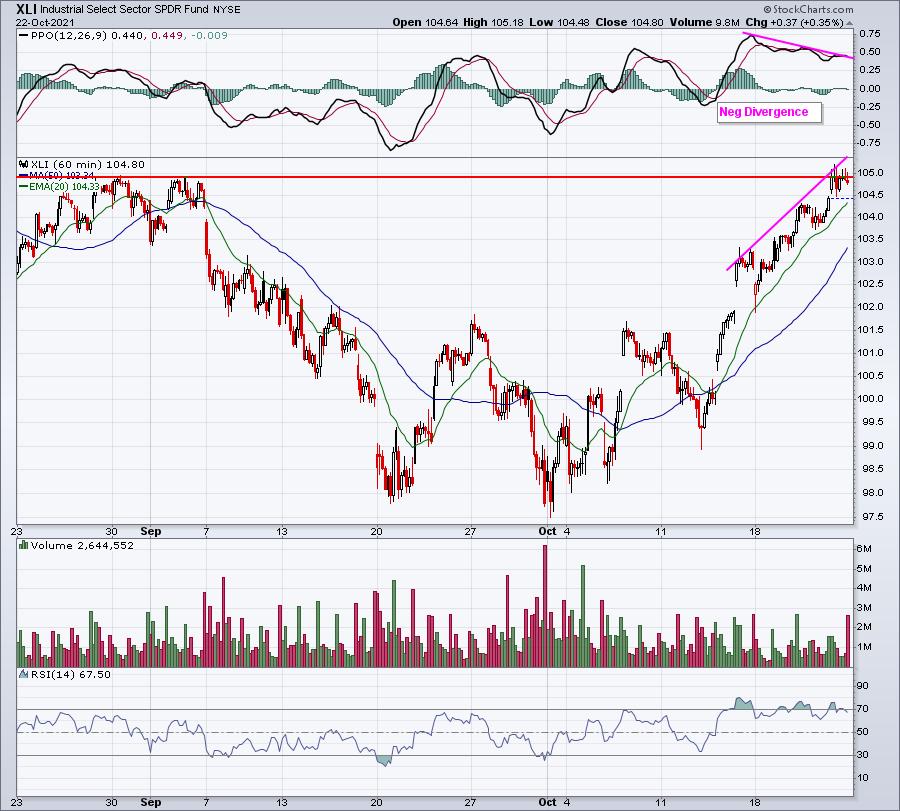
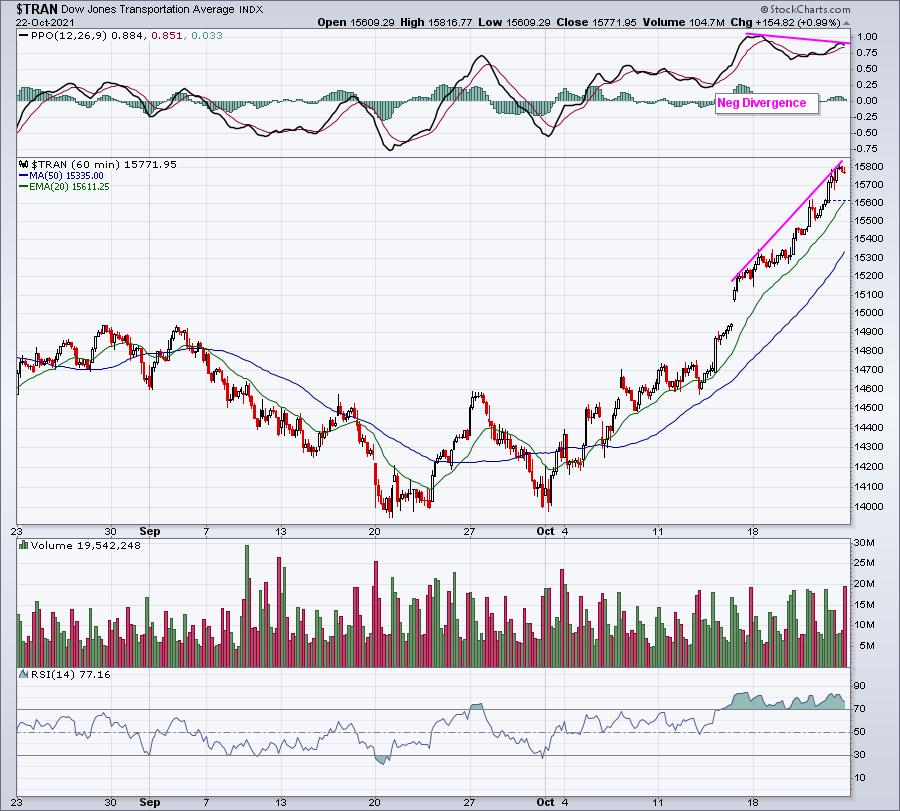
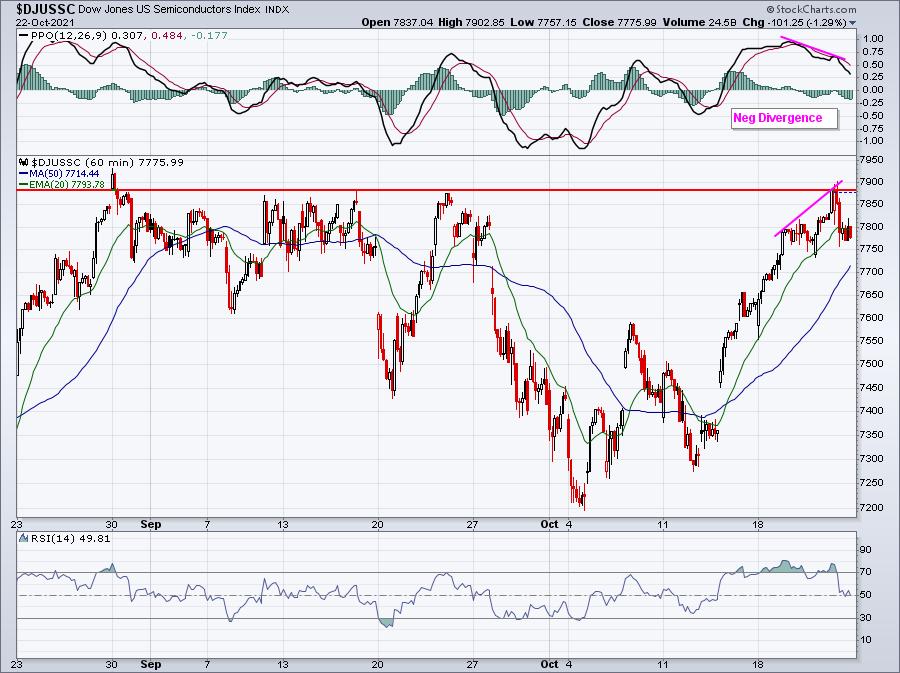
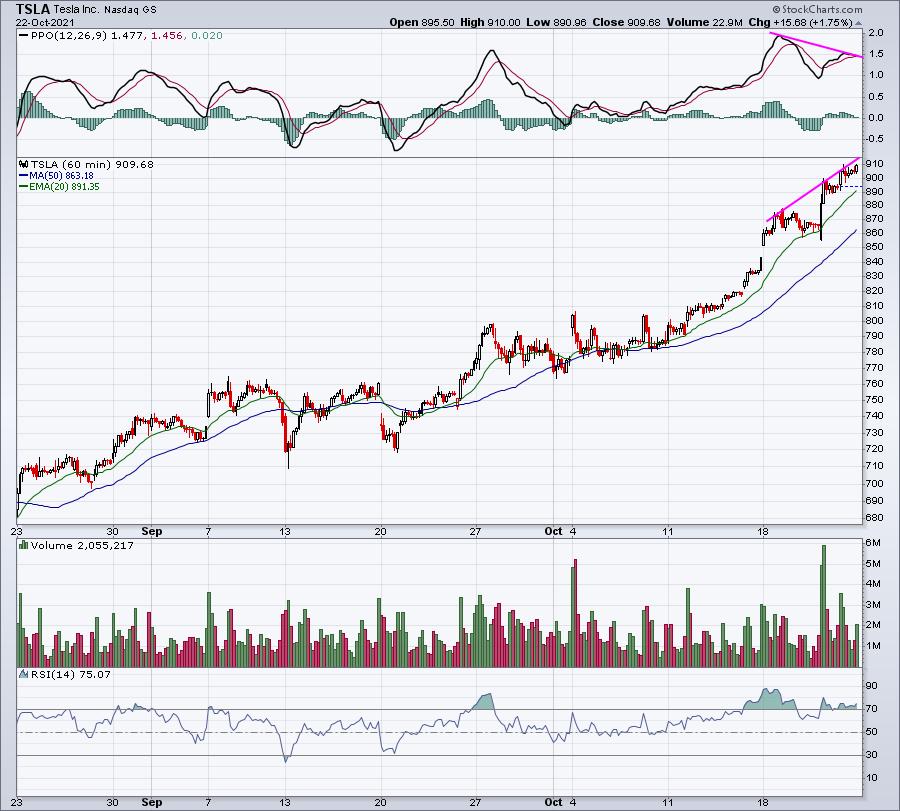
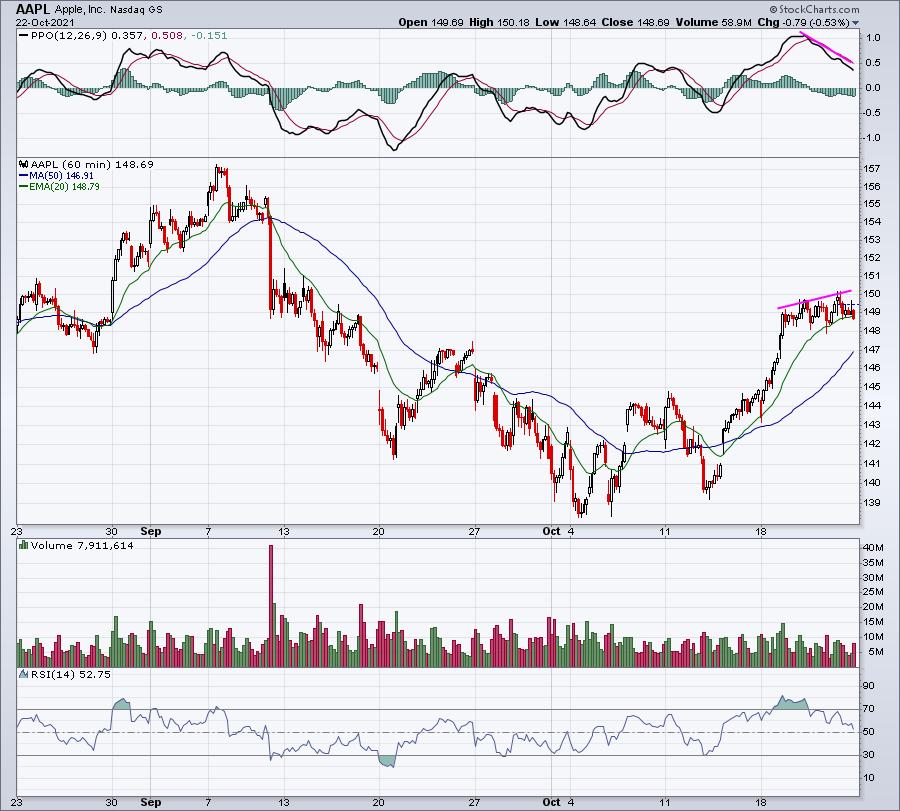
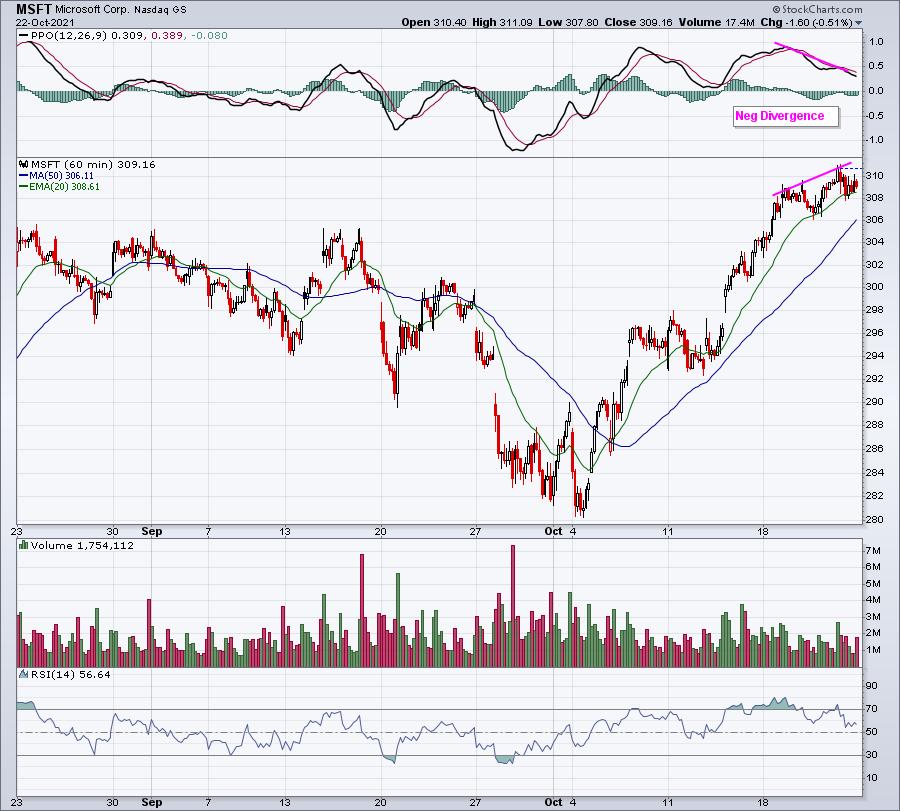
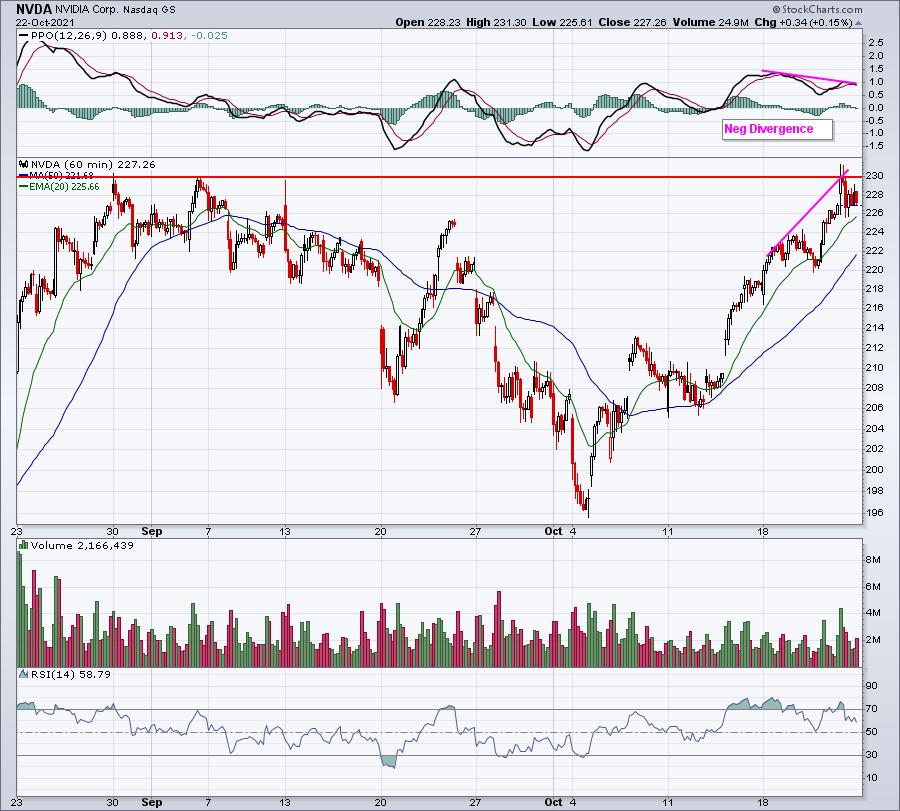
When I began looking at my key index charts this morning, along with sector and industry charts, one thing became apparent very, very quickly. In the near-term, we appear to be running out of bullish momentum. 60-minute divergences are negative across many key indices, sectors, and industries, not to mention the largest market cap companies as well. I couldn't believe how many I saw. This article doesn't require a lot of words. I believe the following hourly charts say everything we need to know right now:
Dow Jones:
S&P 500:
XLK:
XLY:
XLF:
XLI:
Transportation ($TRAN):
Semiconductors ($DJUSSC):
TSLA:
AAPL:
MSFT:
NVDA:
AMD:
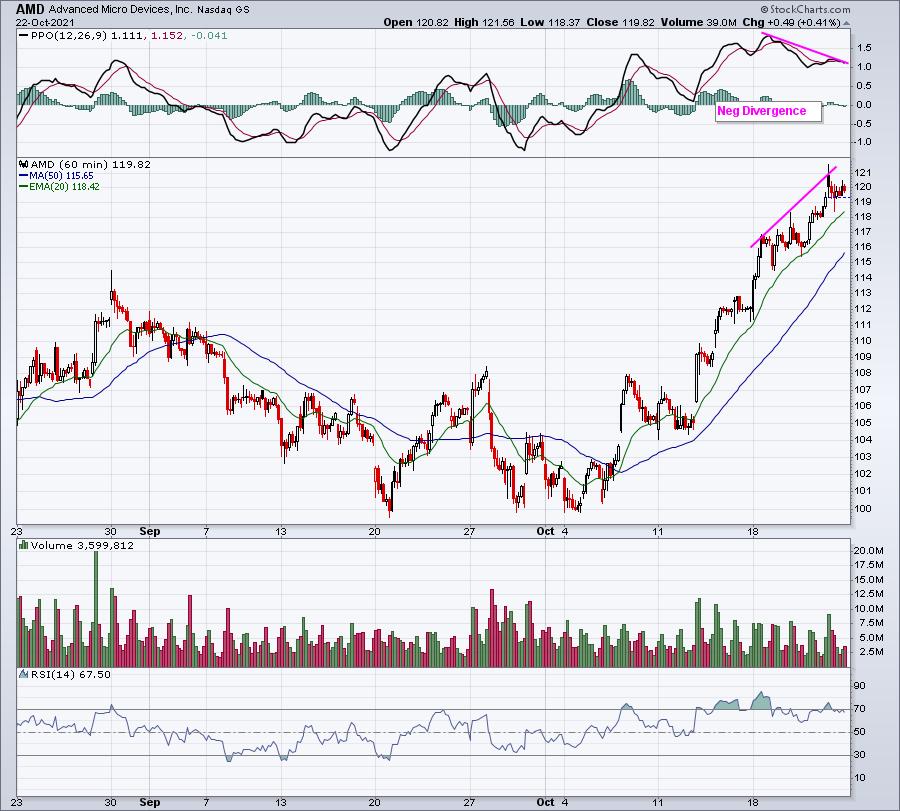
Negative divergences guarantee us nothing, but these are a large number of key charts that reflect slowing momentum. And many of them show key price resistance being tested simultaneously. It's also noteworthy that we have just entered historically the worst week of the year (October 21st close to October 27th close).
Now here's the silver lining.
November is a very strong month for U.S. equities, so if we do pull back next week, it could set up absolutely terrific trading opportunities. In fact, I will feature a stock in our FREE EB Digest newsletter on Monday morning that has risen during November in 19 of the last 20 years. I'm hoping we see a pullback in this one next week, because I love those November odds and this stock is currently the best performer in its industry group! Our newsletter is completely free of charge with no credit card required. Simply provide us your name and email address HERE and we'll get that amazing November stock to you on Monday morning!
Happy trading!
Tom
