Recently, we introduced a newer, very organized way of viewing earnings results at EarningsBeats.com. We call it our Upcoming Earnings ChartList, which our entire community can download into their own StockCharts.com account, assuming that you are either an Extra or Pro members. Others can still view the ChartLists, but won't be able to download them. Downloading and being able to sort them in "Summary" view is key, however. Also, if you can save them in your StockCharts.com account, you can also run scans against them.
We do the leg work. Every day, we dump all the companies that are reporting that day into a ChartList. Therefore, we have 5 each week. The first one will include only those companies that report on Monday morning before the market opens. The second one will include those companies reporting after the closing bell on Monday PLUS those companies reporting before the opening bell on Tuesday morning. By doing this, we can organize our ChartLists to provide us the companies whose prices could change significantly from the prior close and quickly see which companies are being rewarded after their earnings reports vs. the companies being punished. To provide you an example, here was the ChartList for yesterday (included companies reporting after the bell on Tuesday plus those companies reporting before the bell on Wednesday), summarized by leaders:
Top 10 Earnings Performers:

Worst 10 Performers:

There's plenty to do with this ChartList, the above is simply highlighting the best performers from the worst performers. You can also run scans to find companies that gap up more than a certain percentage and then fall back below the prior close (gap fill). To give you an example of today's LIVE ChartList (as the stock market just opened), check out today's big winners:

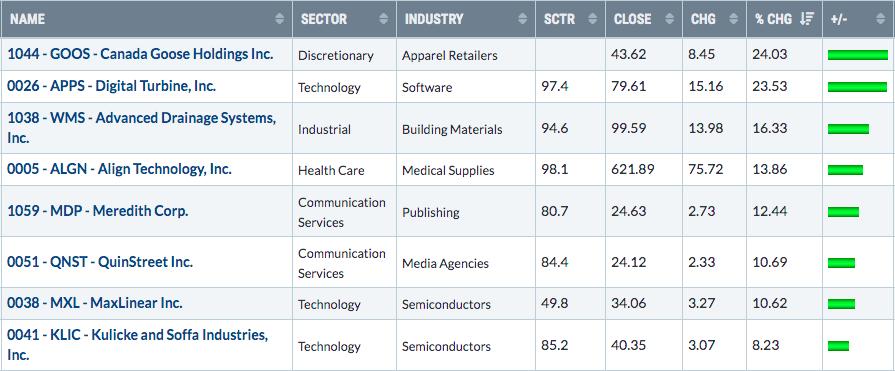
These are the 6 earnings-related gaps higher in excess of 10% in the first minute of trading today.
25 minutes later, here are your top performers:

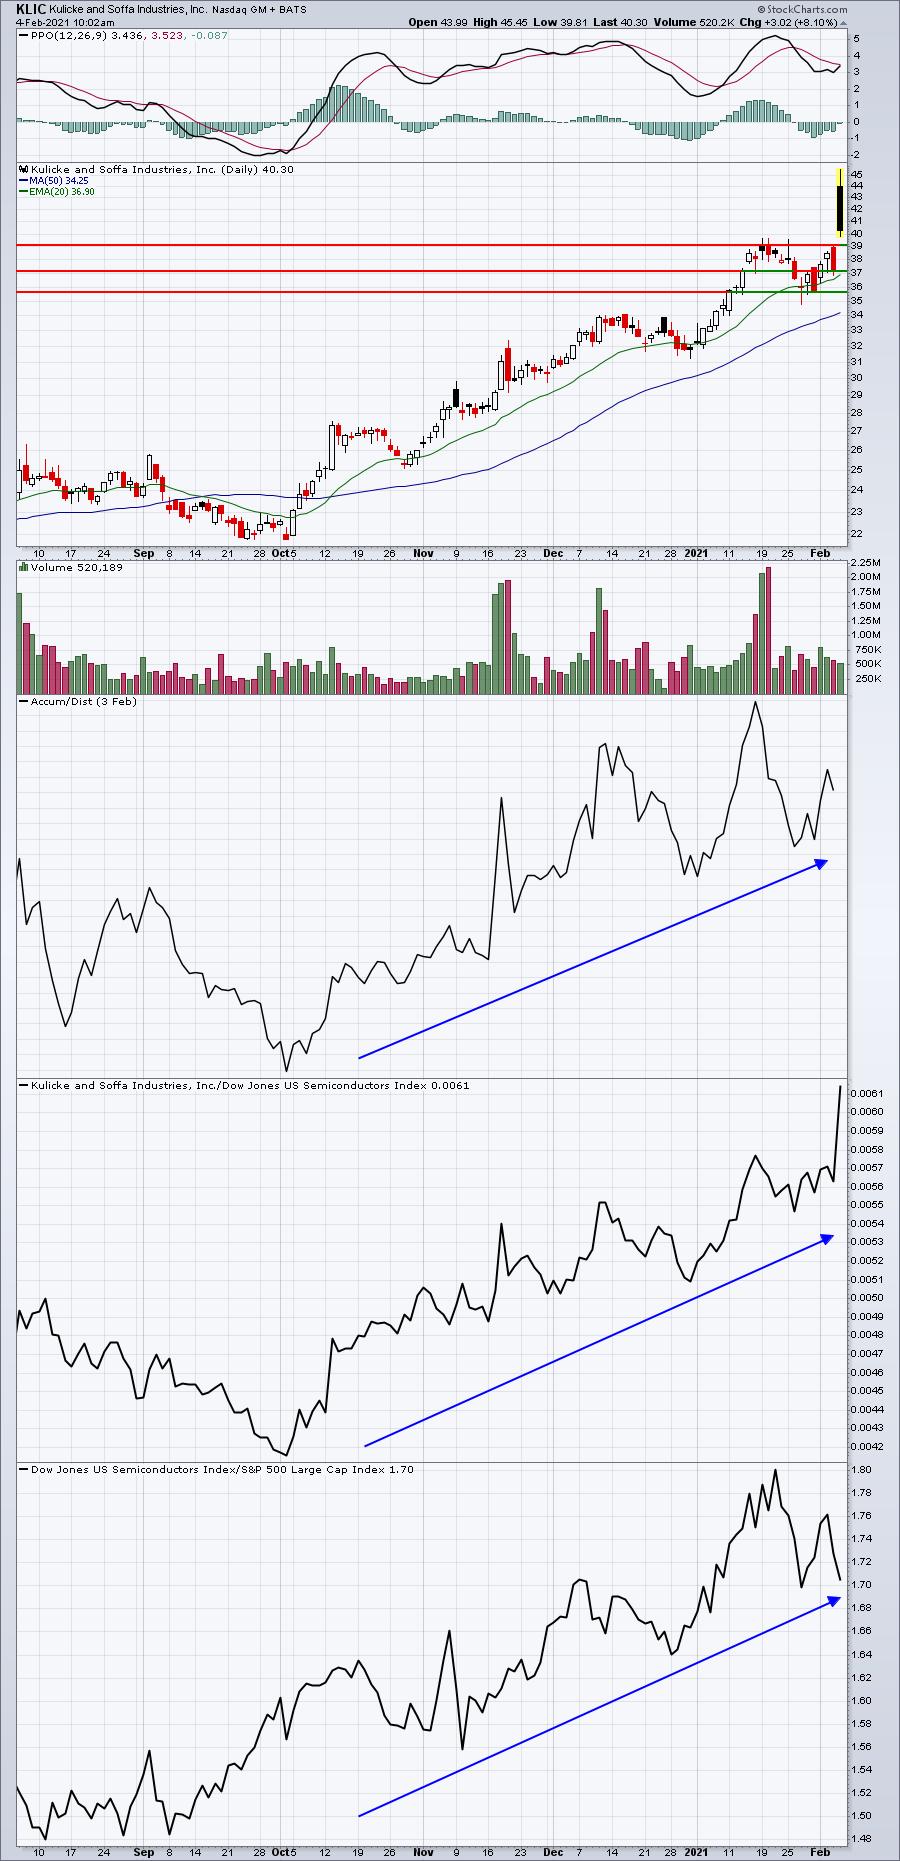
The leaderboard changed a bit with one notable change - KLIC. It was up 20.7% at the open, but just 8.2% 25 minutes later. Market makers have taken control at the opening bell and those buying at the open are down 7-8% very quickly. It's amazing to watch the post-earnings volatility. I love the chart on KLIC, however:

KLIC has been a solid performer within an exceptional industry group - semiconductors ($DJUSSC). So after posting blowout results, market makers are directing traffic here. Don't be surprised, however, if KLIC finds support at a key gap/price support level and turns higher again.
These ChartLists are a pretty cool feature for a trader looking to benefit from opening gaps (or potentially shorting them, if that's your style). It's also important from a longer-term perspective to see which areas of the market are being rewarded for strong results. These can be great investments for the next quarter and beyond. Great earnings reports and great responses are staples in our portfolio selection process:

We're providing these Upcoming Earnings ChartLists to our entire EB Digest community. The EB Digest is our free newsletter (no credit card required). It's published every Monday, Wednesday, and Friday and now includes a link and password for our community to download/view our Upcoming Earnings ChartLists. If you'd like to get your Earnings ChartLists handed to you to better summarize and organize earnings season, CLICK HERE to sign up for our EB Digest with your name and email address.
Happy trading!
Tom
