This has been the quarter for short squeezes. It's been crazy. The beauty from the long side is that once these stocks make breakouts, the pressure builds on short sellers to cover their positions. Unfortunately, many have the same emotional connection to their bearish bets that many long traders have with stocks they own on the long side. But there's one big difference. A long knows the maximum amount to be lost on a trade - their investment. Short sellers have unlimited risk and that can really play havoc on your intestinal fortitude.
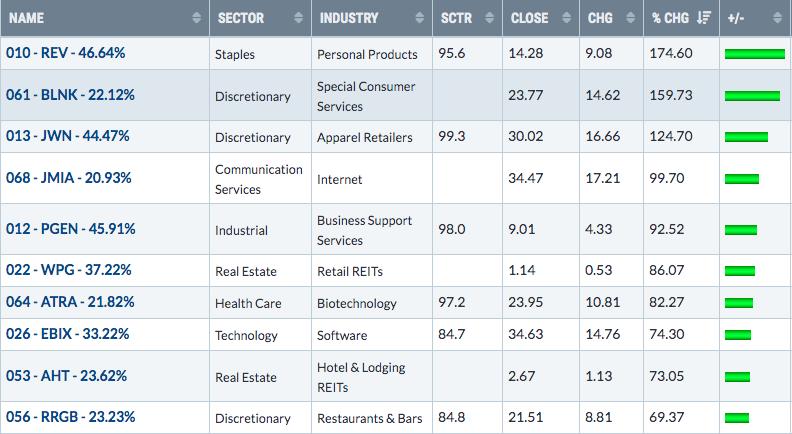
Here's our current Short Squeeze ChartList - Top 10 performers over the past month:

(REV, leader of the pack, is up another 20% today on increasing volume.)
Look at those one month returns! Yeah, I know the S&P 500 is up roughly 6.6% in the past 30 days, but the above returns are astronomical! By the way, the percentages next to the ticker symbols represent each stock's "short % of float", which we pass along to our members. We update our Short Squeeze ChartList once a month so we always have the latest short numbers.
We currently have 74 stocks on our Short Squeeze ChartList and 48 of them have beaten the S&P 500's 6.6% return over the past month. In fact, the average return of all 74 stocks over the past month is +27.86% - that's more than 4x the S&P 500 return and is insane!
Our Short Squeeze ChartList is a GREAT place to find incredible trades, especially for aggressive traders. Many stocks are shorted for a reason, but many break out, begin to show relative strength, and then explode higher as short sellers try to figure out how to keep losses from ruining them. If you're an options trader, imagine the potential gains there.
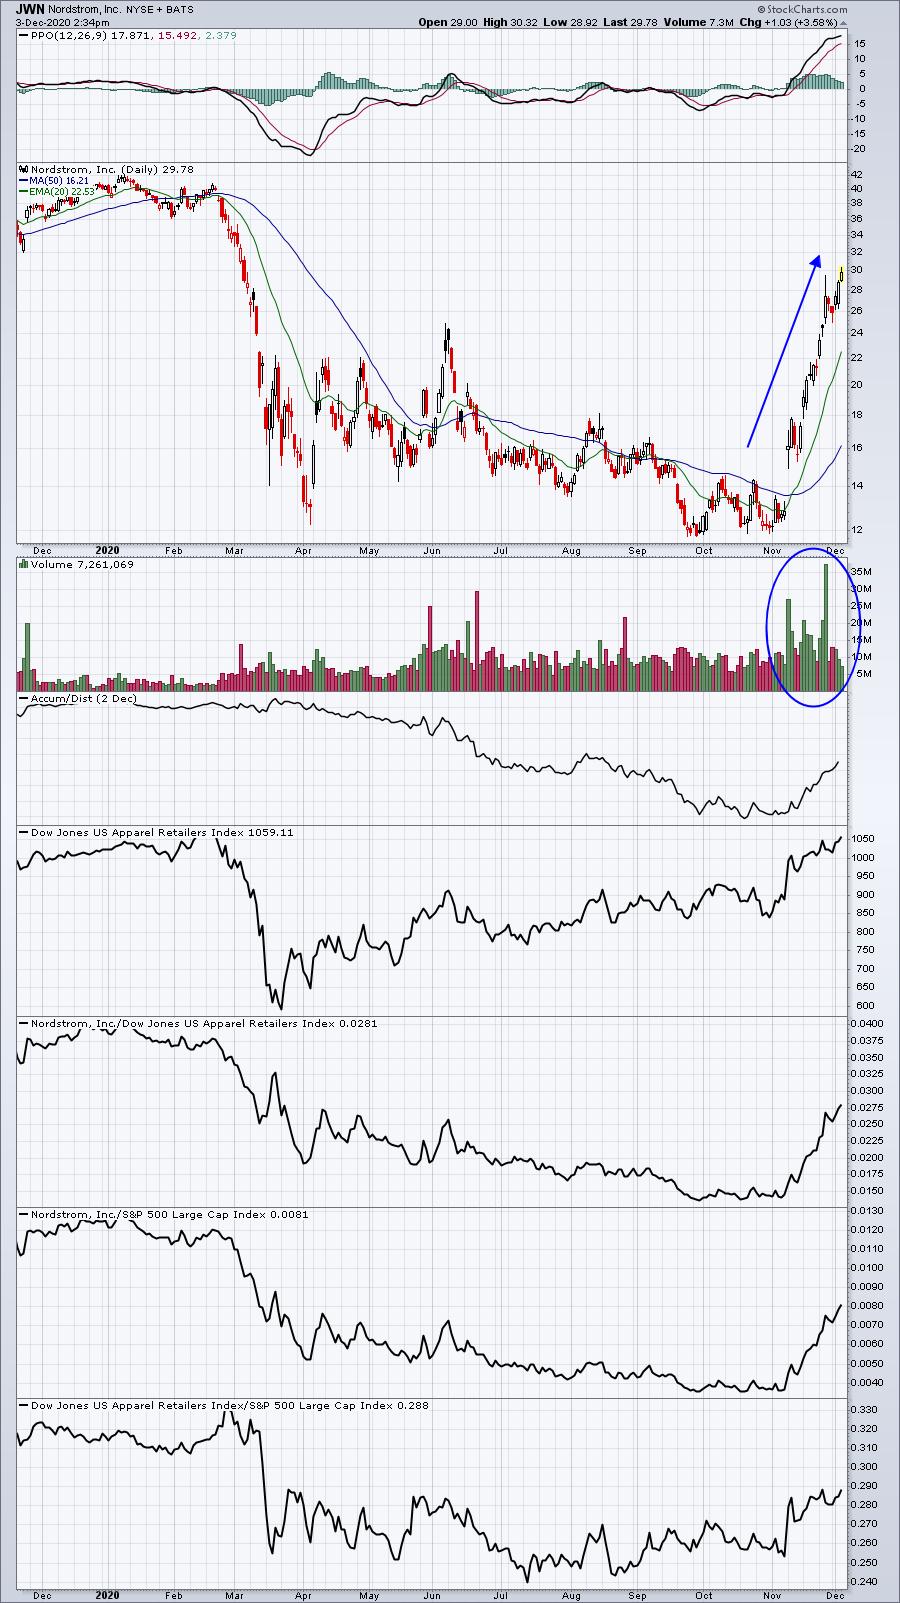
Let me show you what happens when a heavily shorted stock breaks out and the pressure it creates for short sellers:

Much of this is stemming from the rotation we've seen in the fourth quarter. Positive vaccine news has triggered buying in beaten-down areas of the market and as technical conditions improve, more buyers appear. Then short sellers cover, adding more buying pressure, and the cycle continues over and over again.
On November 9th in my Daily Market Report to EarningsBeats.com members, I provided two short squeeze candidates. One was JWN, trading at 16.02 and just gapping higher, breaking its downtrend, and FLXN, trading at 12.80. They've gone in two different directions. As of today's current price, JWN is up 86% in just over 3 weeks. FLXN, on the other hand, never saw a short squeeze materialize and is down 11%. While the "hit ratio" was just 1 out of 2, or 50%, an 86% winner like JWN can carry an entire portfolio. That's the beauty of short squeezes.
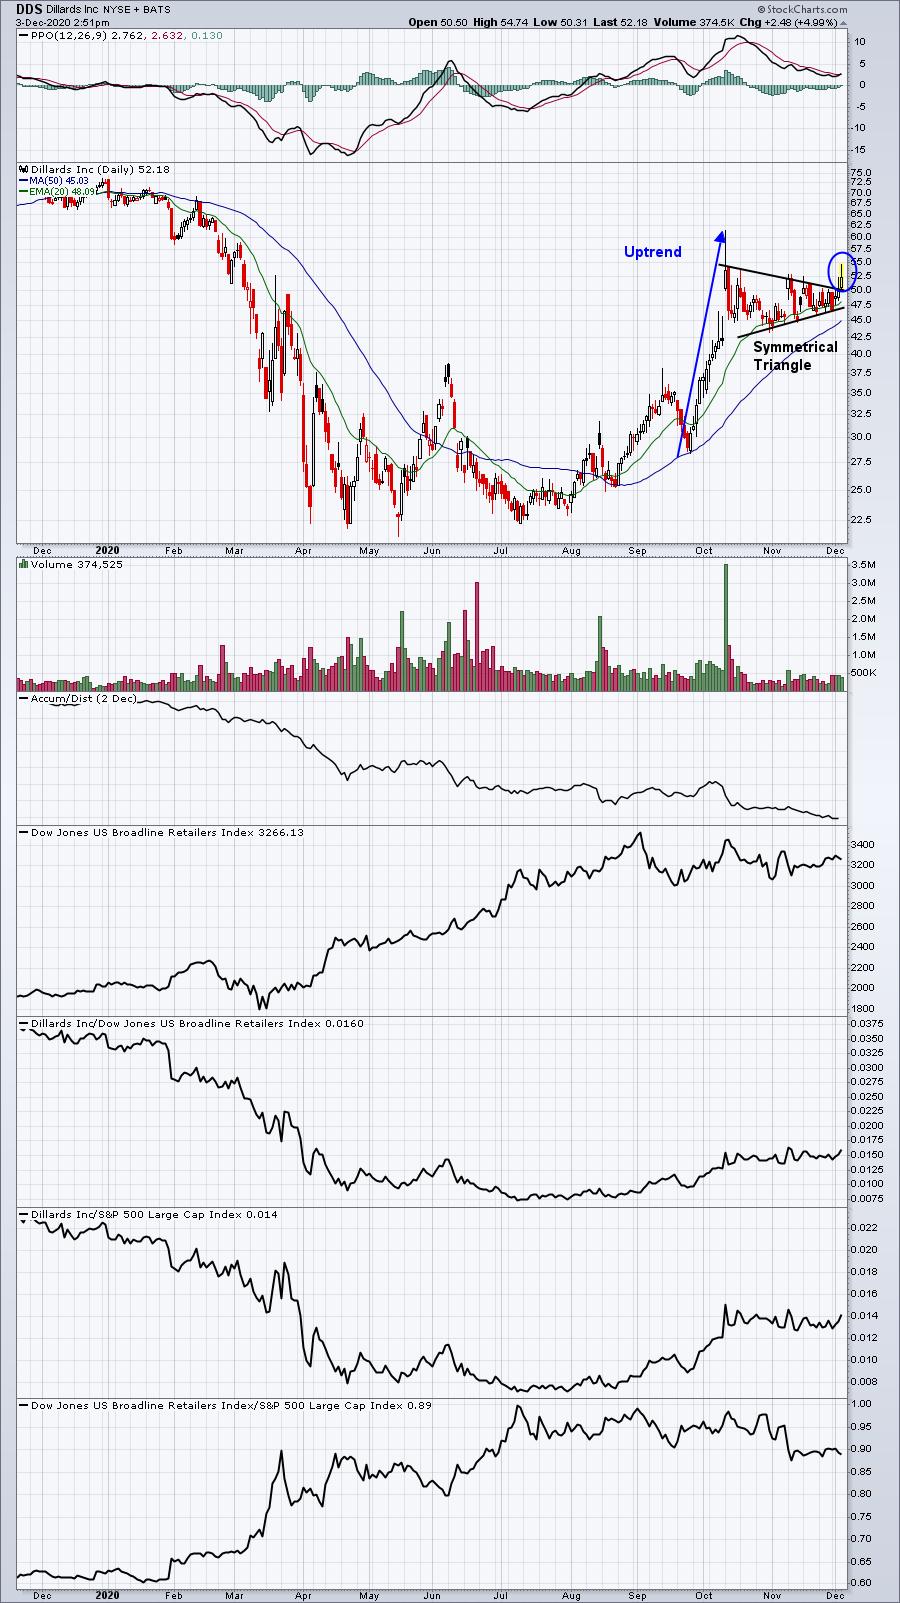
Last week in ChartWatchers, my partner John Hopkins wrote about these short squeeze candidates and promised another Short Squeeze candidate just waiting for breakout from an bullish, symmetrical triangle pattern. I wrote about it in our free newsletter, EB Digest, on Monday. The stock was Dillards, Inc. (DDS), a broadline retailer that's broken out of its triangle, but has yet to break above its October high:

From its low on Monday (46.53) to test the lower uptrend line in the triangle pattern to its high today (54.74), threatening breakout, DDS rose more than 17% and demonstrates just how quickly these stocks can move. And we haven't even seen the ultimate breakout yet!
Tomorrow morning, I'll be releasing yet another short squeeze candidate from our list. It has a very high short percentage of float and could absolutely explode with a breakout, and it's threatening that breakout this afternoon. If you'd like to see this potential short squeeze candidate, simply CLICK HERE to sign up for our free EB Digest newsletter. There's no credit card required and you may unsubscribe at any time.
Happy trading!
Tom
